Table Chart Documentation - Visualizer Library
When creating a table chart, there are two libraries available - Google Charts and DataTable:
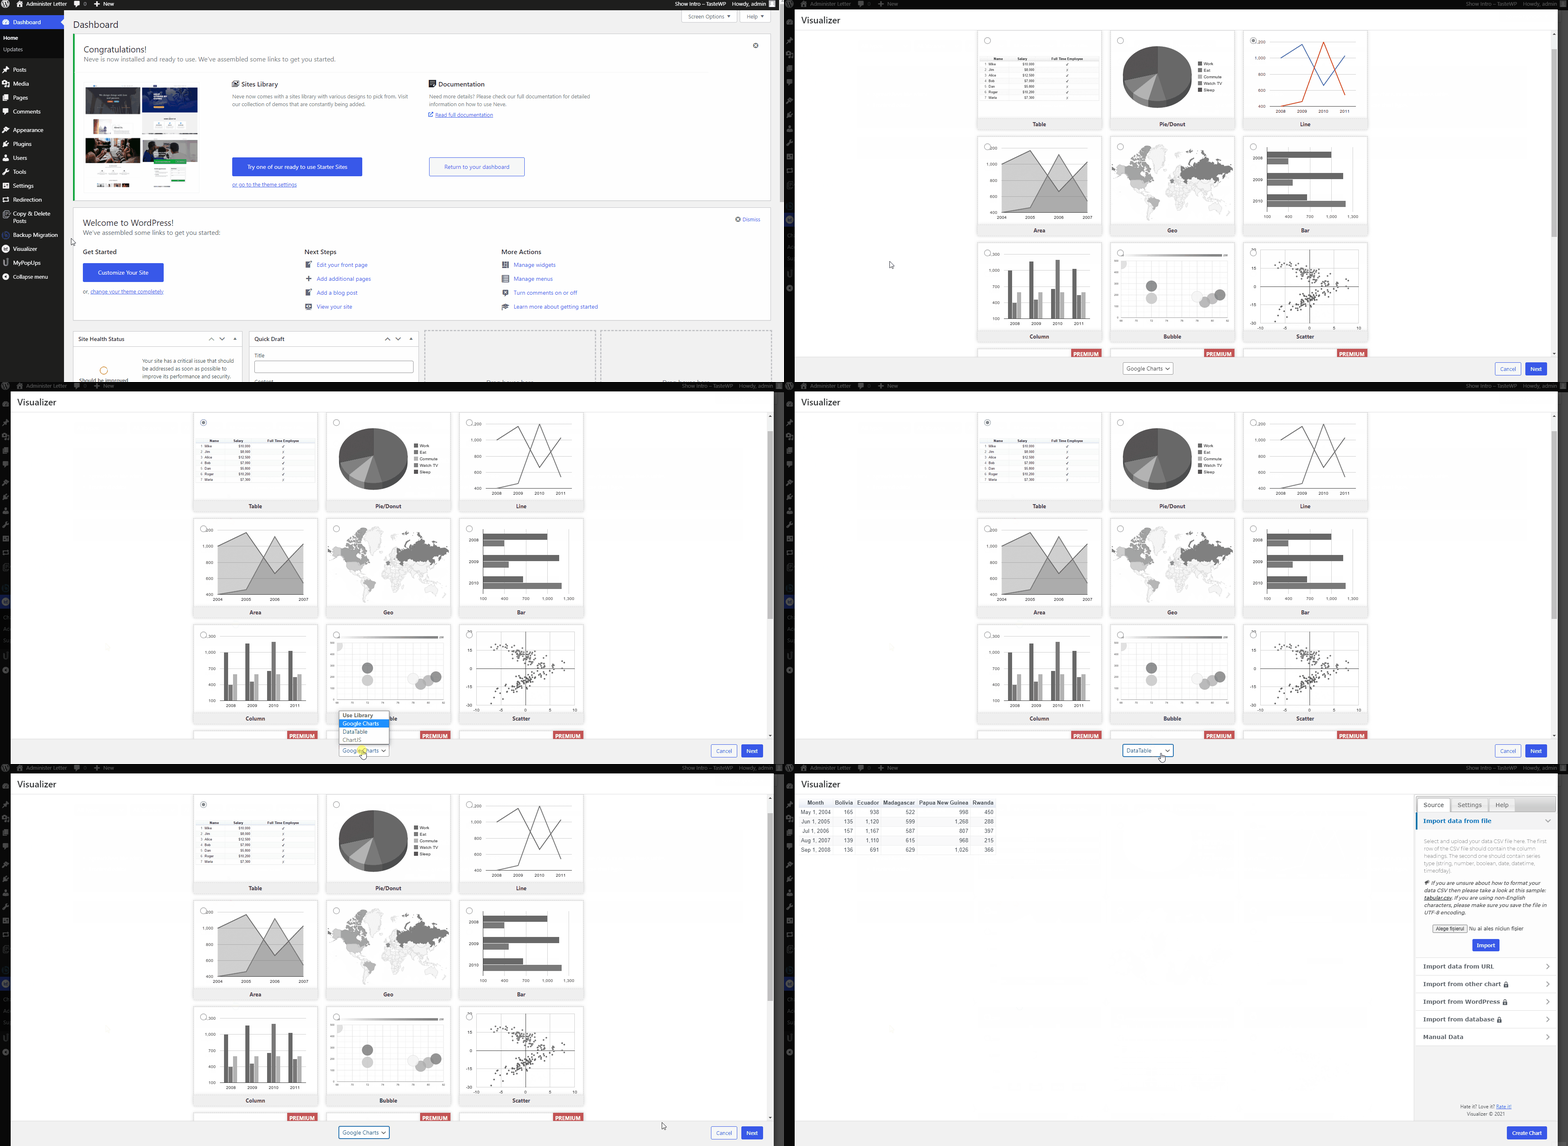
📝 Note: If you need help with creating a chart, check the following doc.
The table is one of the multiple types of charts available in Visualizer.
In this article
Table options
Source
This is the tab responsible for importing files. It has many options available:
- import data from file - upload a data CSV or XLSX file ( PRO ).
- import data from URL ( PRO ) - import data from a remote CSV/XLSX file or Google Spreadsheet / from a remote JSON source.
- import data from another chart ( PRO ) - import data from previously created charts.
- import data from WordPress ( PRO ) - plus the possibility to choose how often to refresh the data from WordPress.
- Import data from the database ( PRO ) - plus the possibility to choose how often to refresh the data from the database.
- Manual Data - choose what type of editor to use, to manually edit the chart data.
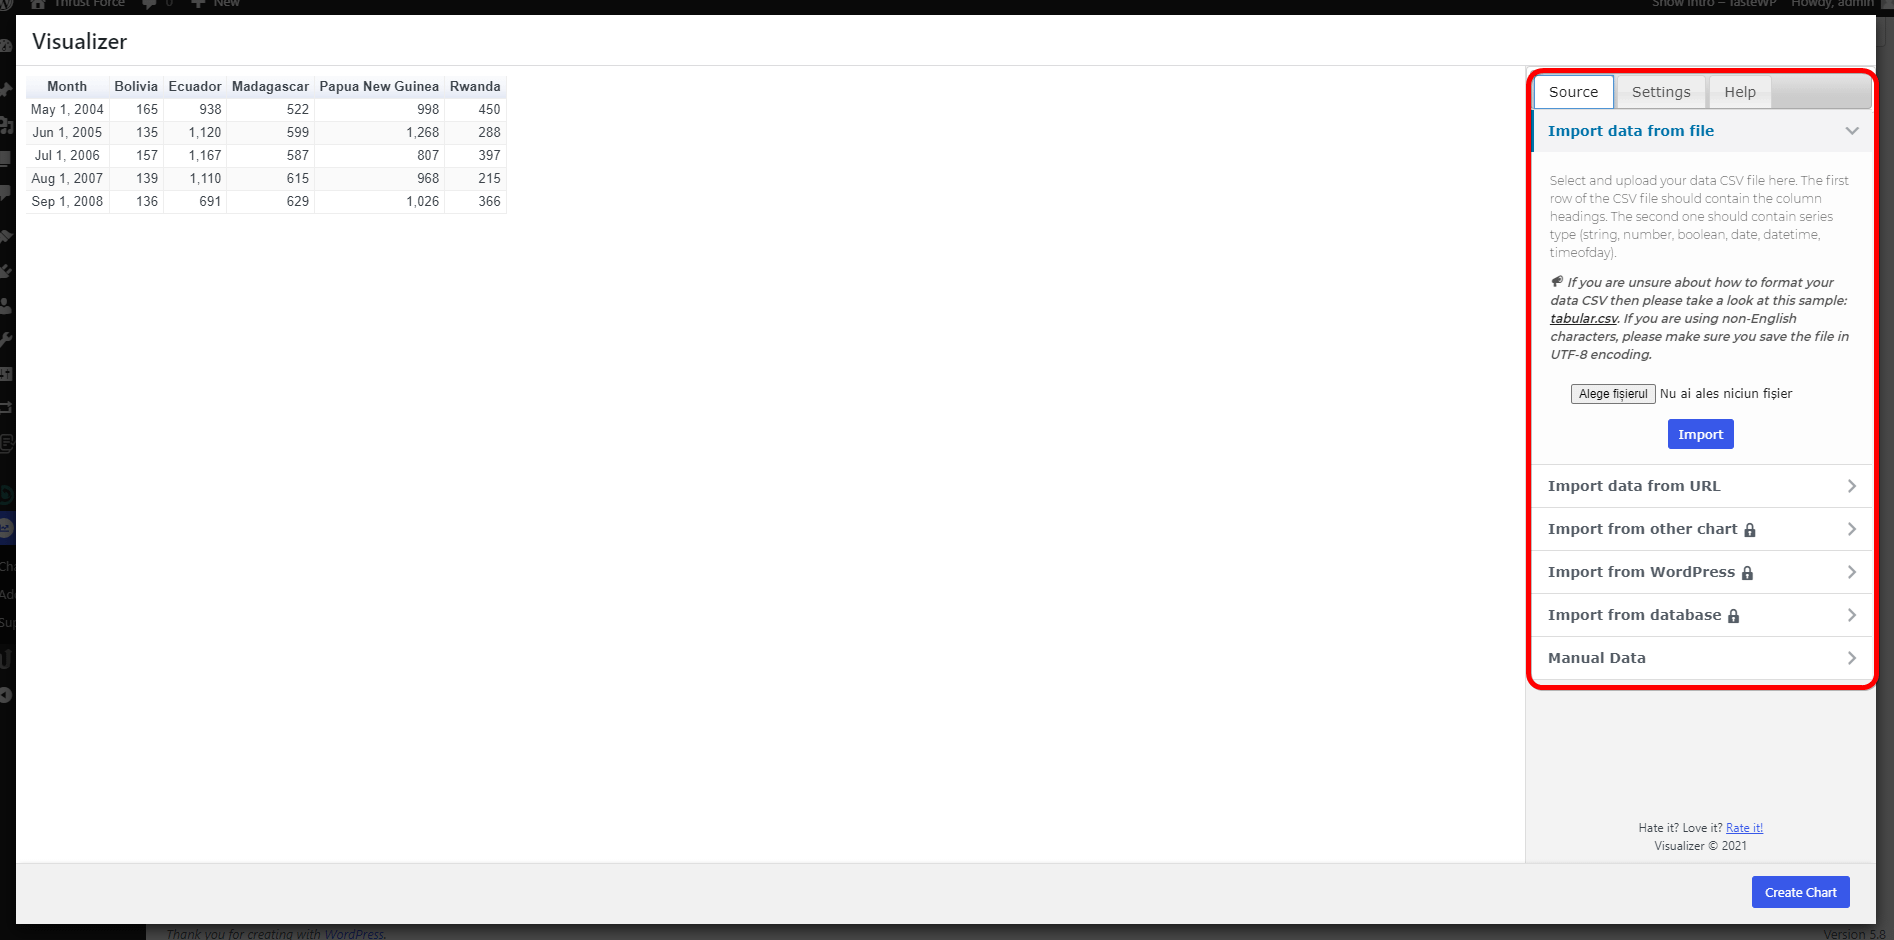
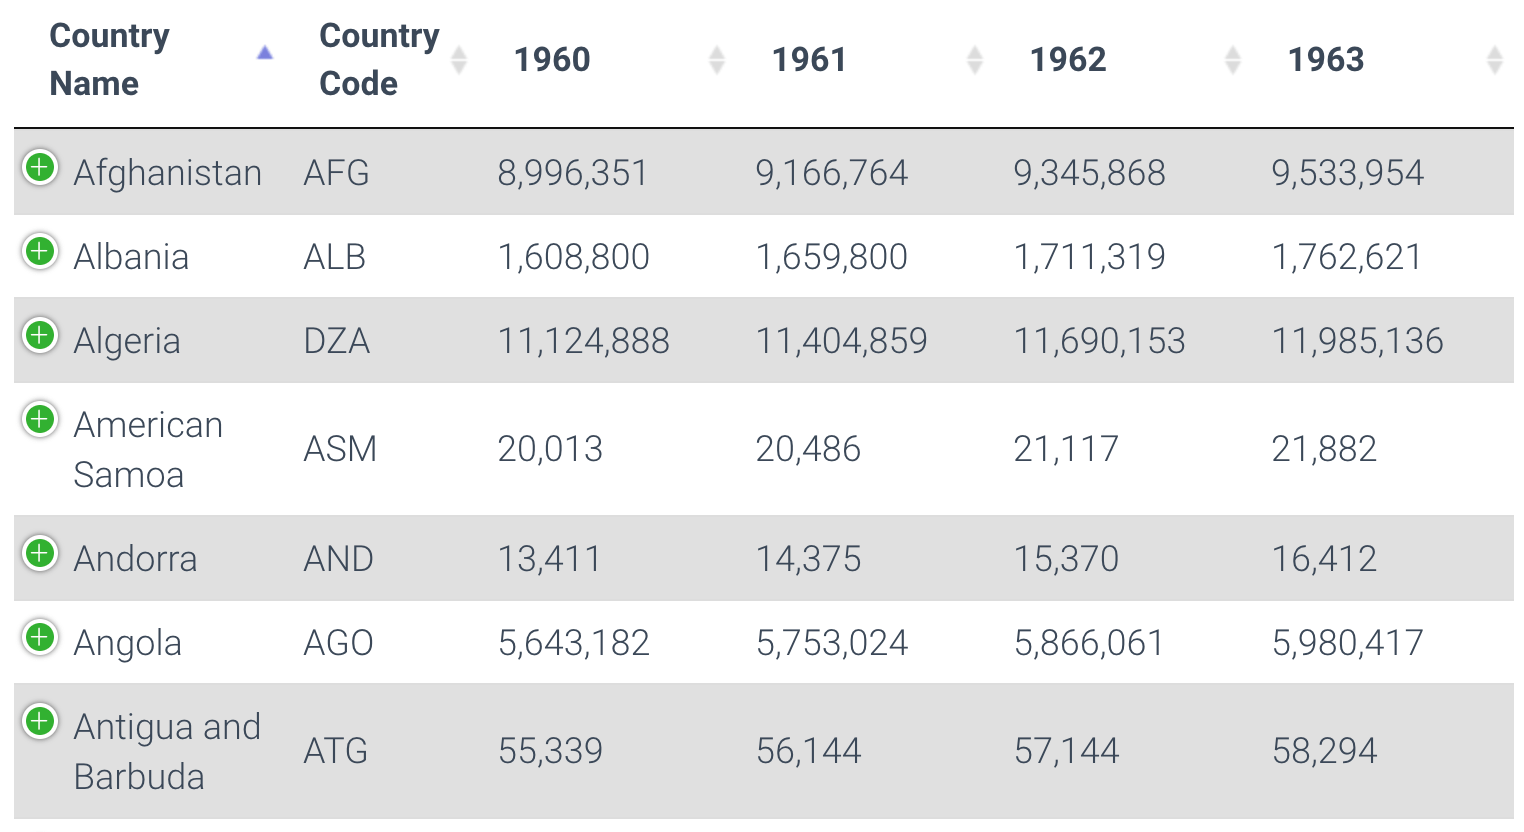
Table Chart Settings - DataTable
| General Settings | Table Settings |
| Row / Cell Settings | Column Settings |
| Frontend Actions |
General Settings
The options available in the DataTable library are:
- Chart Title - will be displayed only in the back-end area and can be used to search/filter charts, viewable only for the admin.
- Chart Description - will be used in the structured data schema.
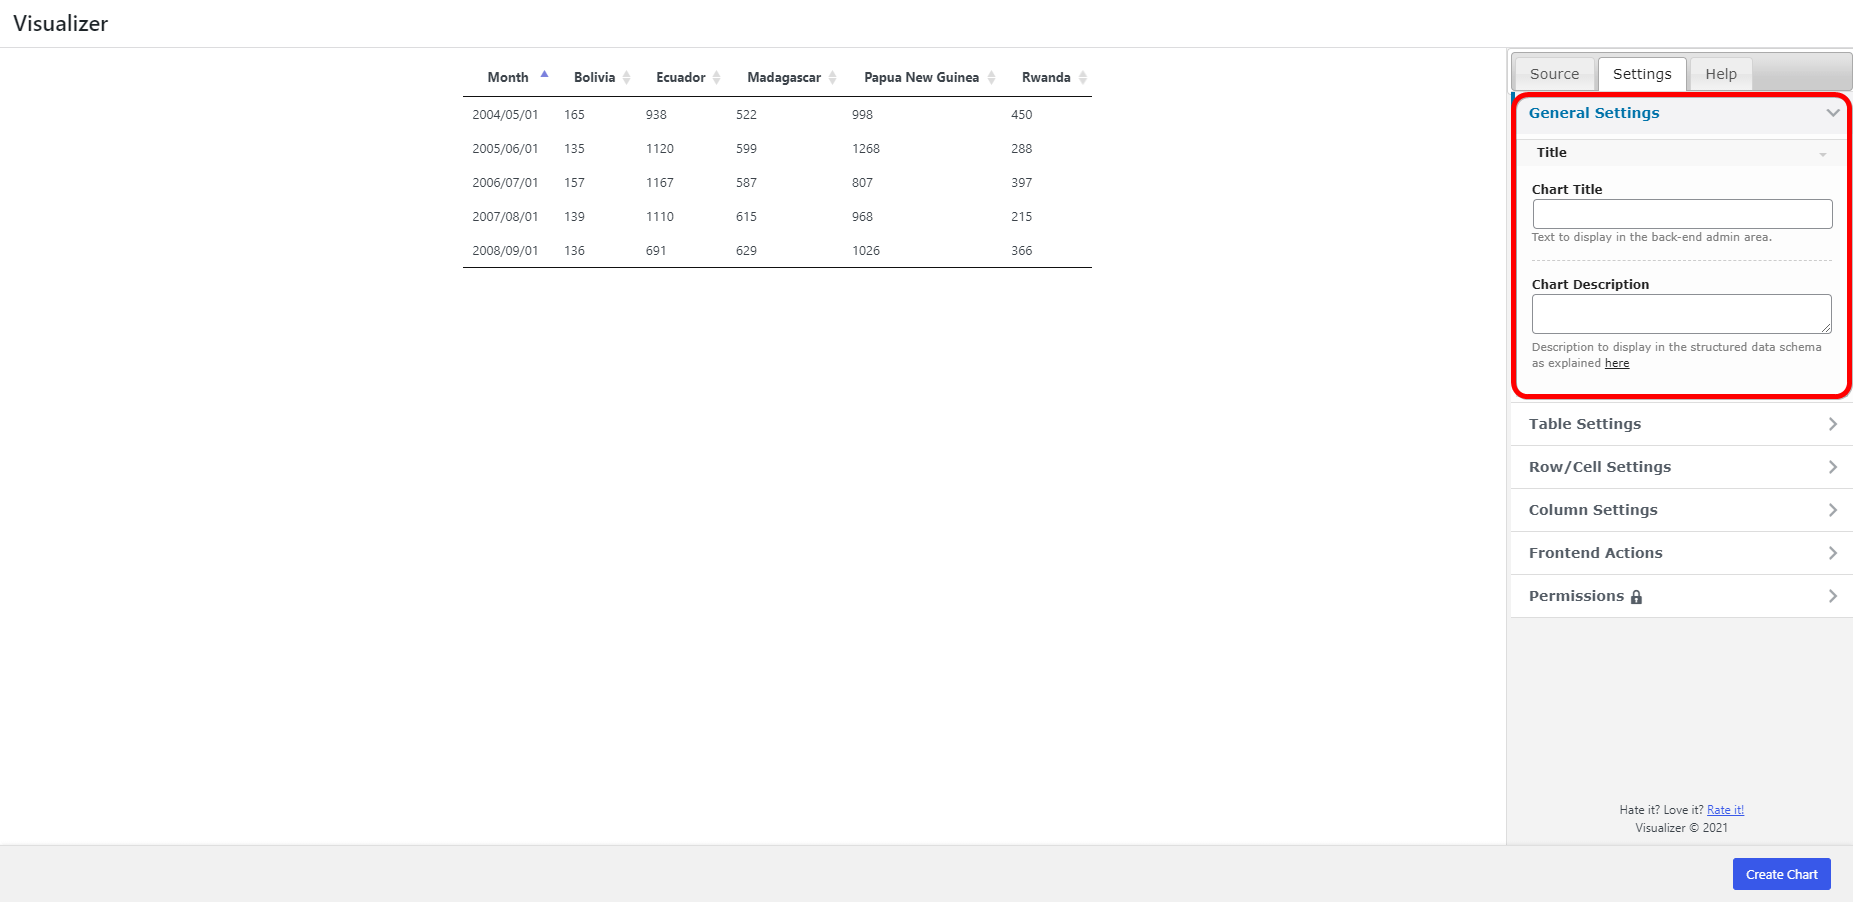
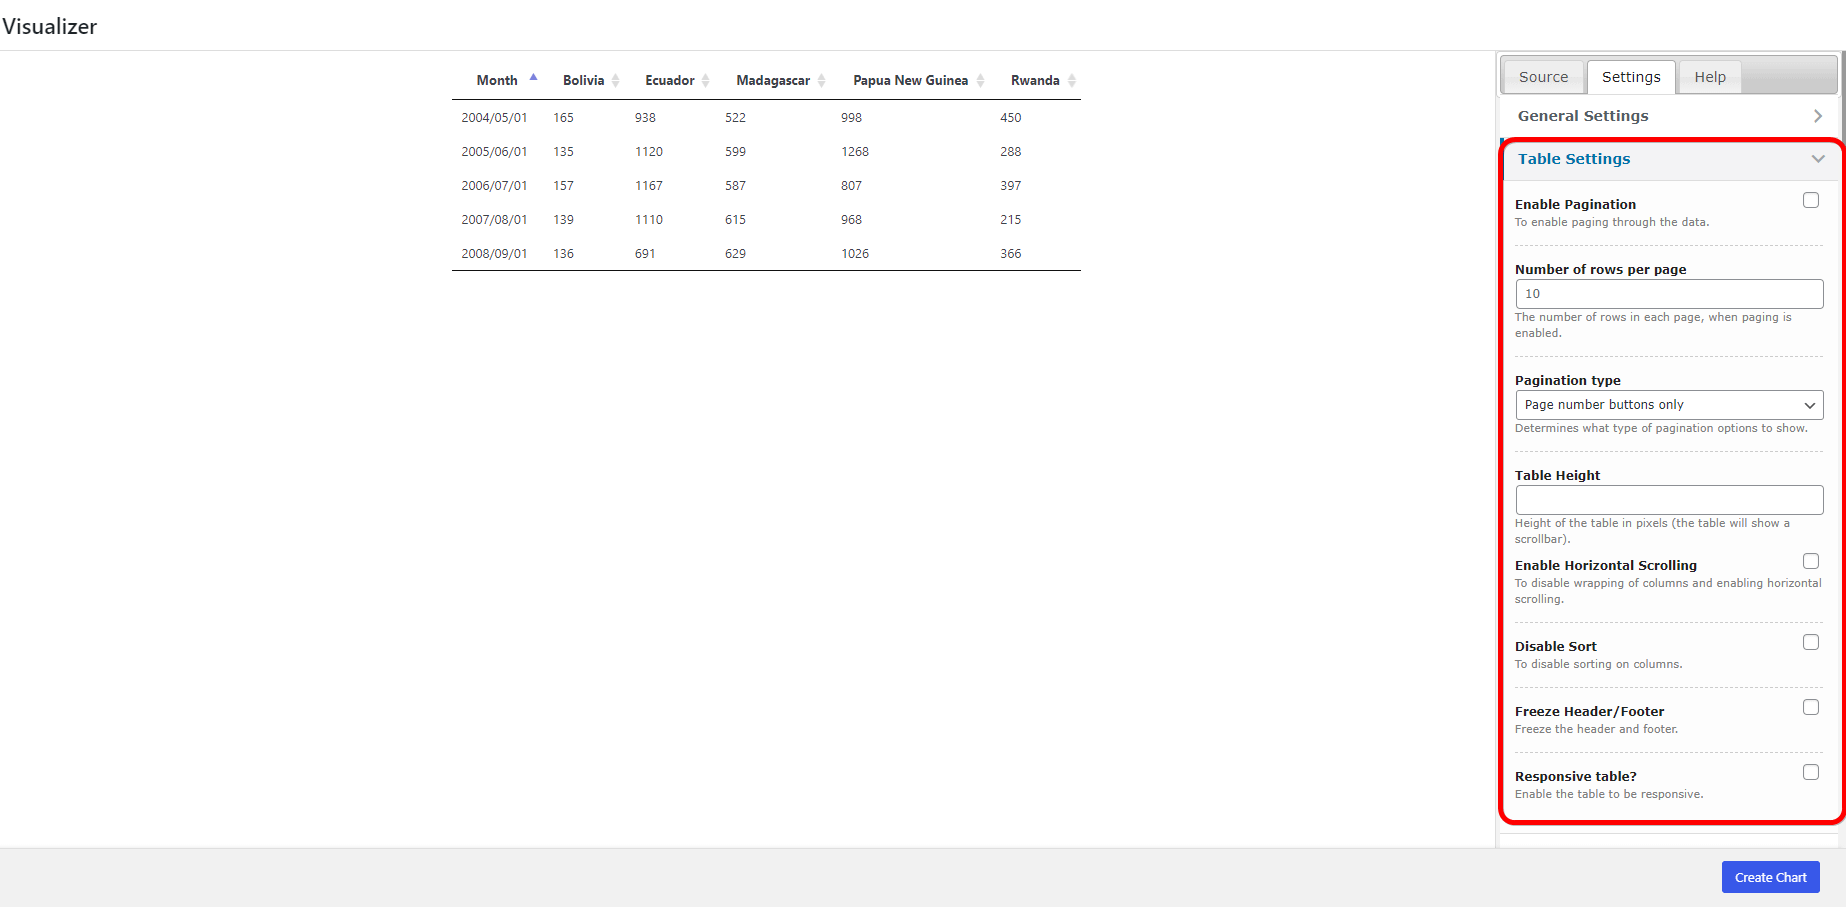
Table Settings
This particular area lets you change almost anything you would need:
- Pagination - enable/ disable
- Number of rows per page - appears when paging is enabled and establish the number of rows for each page
- Pagination type - determines the desired type of pagination to show:
- page number buttons only
- "Previous" and "Next" buttons only
- "Previous" and "Next" buttons, plus page numbers
- "First", "Previous", "Next" and "Last" buttons
- "First", "Previous", "Next" and "Last" buttons, plus page numbers
- "First" and "Last" buttons, plus page numbers
- Table Height - lets you control how tall the table should be, attaching a scrollbar.
- Enable Horizontal Scrolling - it's useful if your table is very wide. You can enable horizontal scrolling to make sure all the data is accessible to your visitors.
- Disable Sort - by default, charts have a sorting mechanism for each column ( the little arrows near each column heading ). This option allows for disabling the sorting feature.
- Freeze Header/Footer - The header/footer will always be visible on scroll by enabling this option.
- Responsive Table - if you check this, the table will be responsive and it will adjust itself according to the device it's being viewed on.
Row / Cell Settings
In this panel are available three types of settings:
- Background color
- Color
- Text Orientation (in degrees)
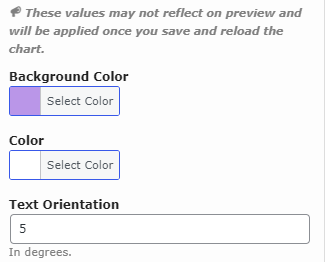
These settings can be observed for four areas:
- Header Row - these settings will be applied to the header ( purple + test orientation = 5 ).
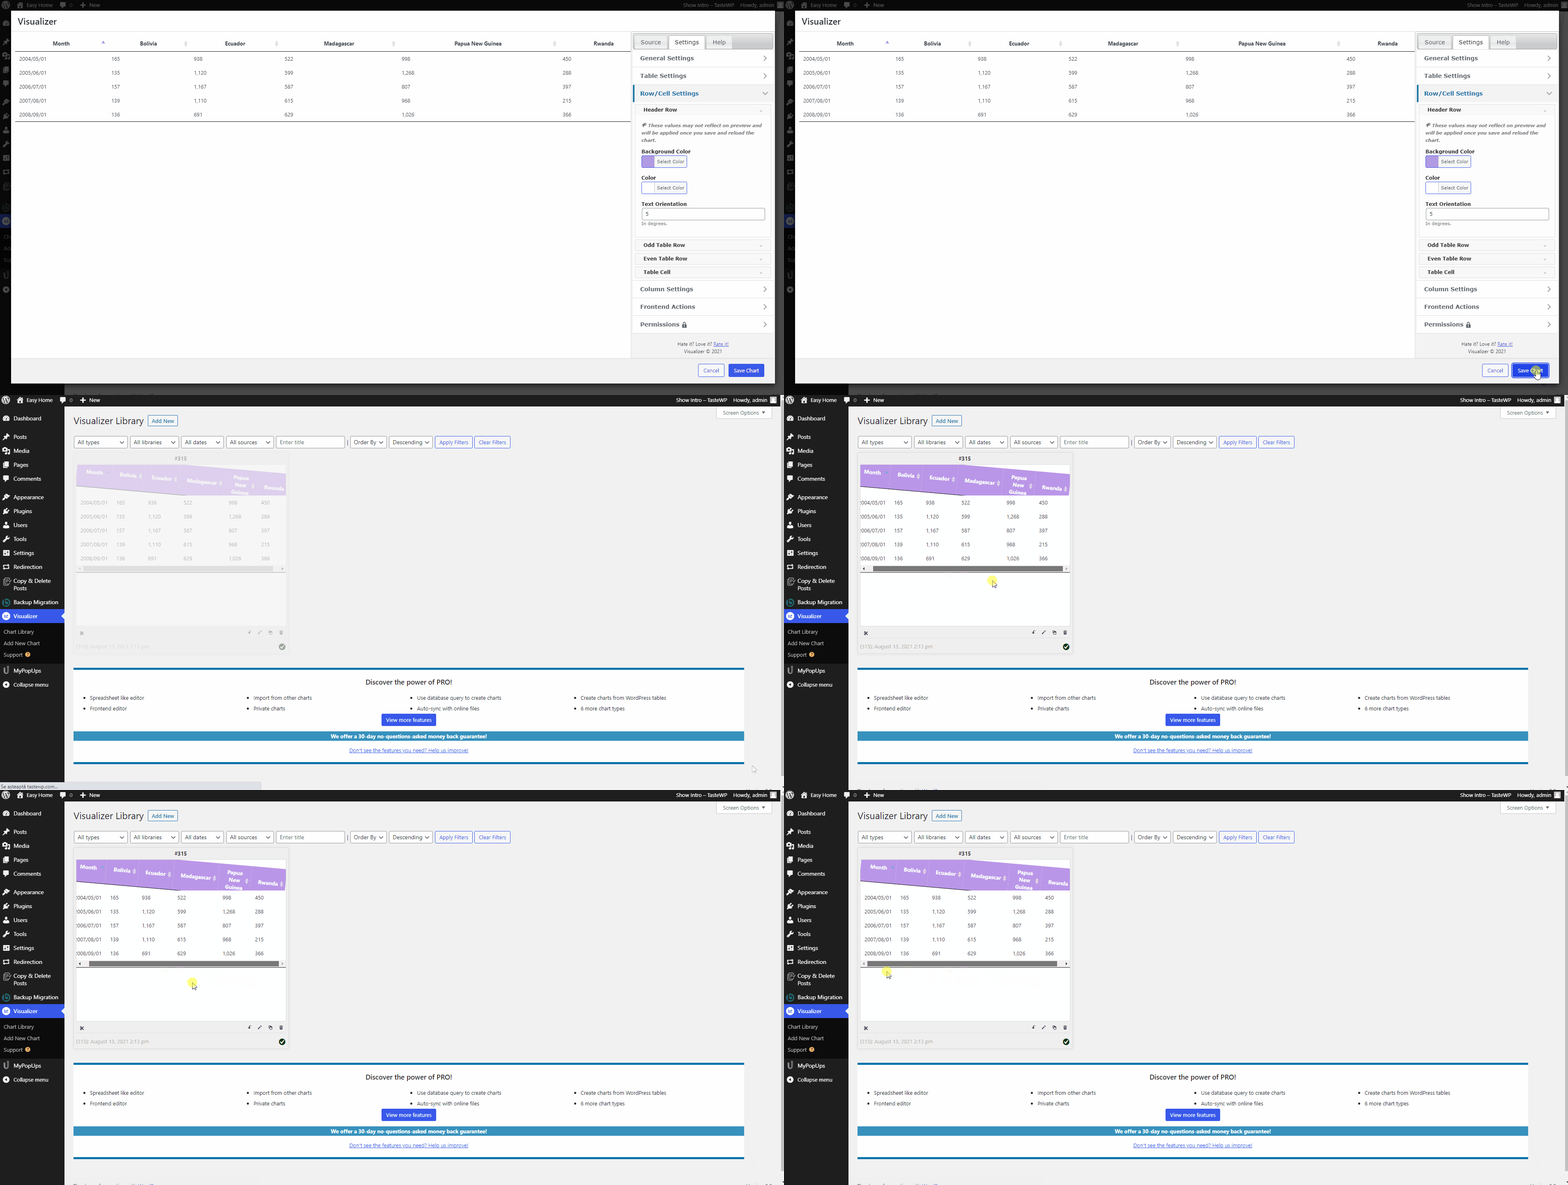
- Odd Table Row - these settings will be applied only to the odd rows ( blue ).
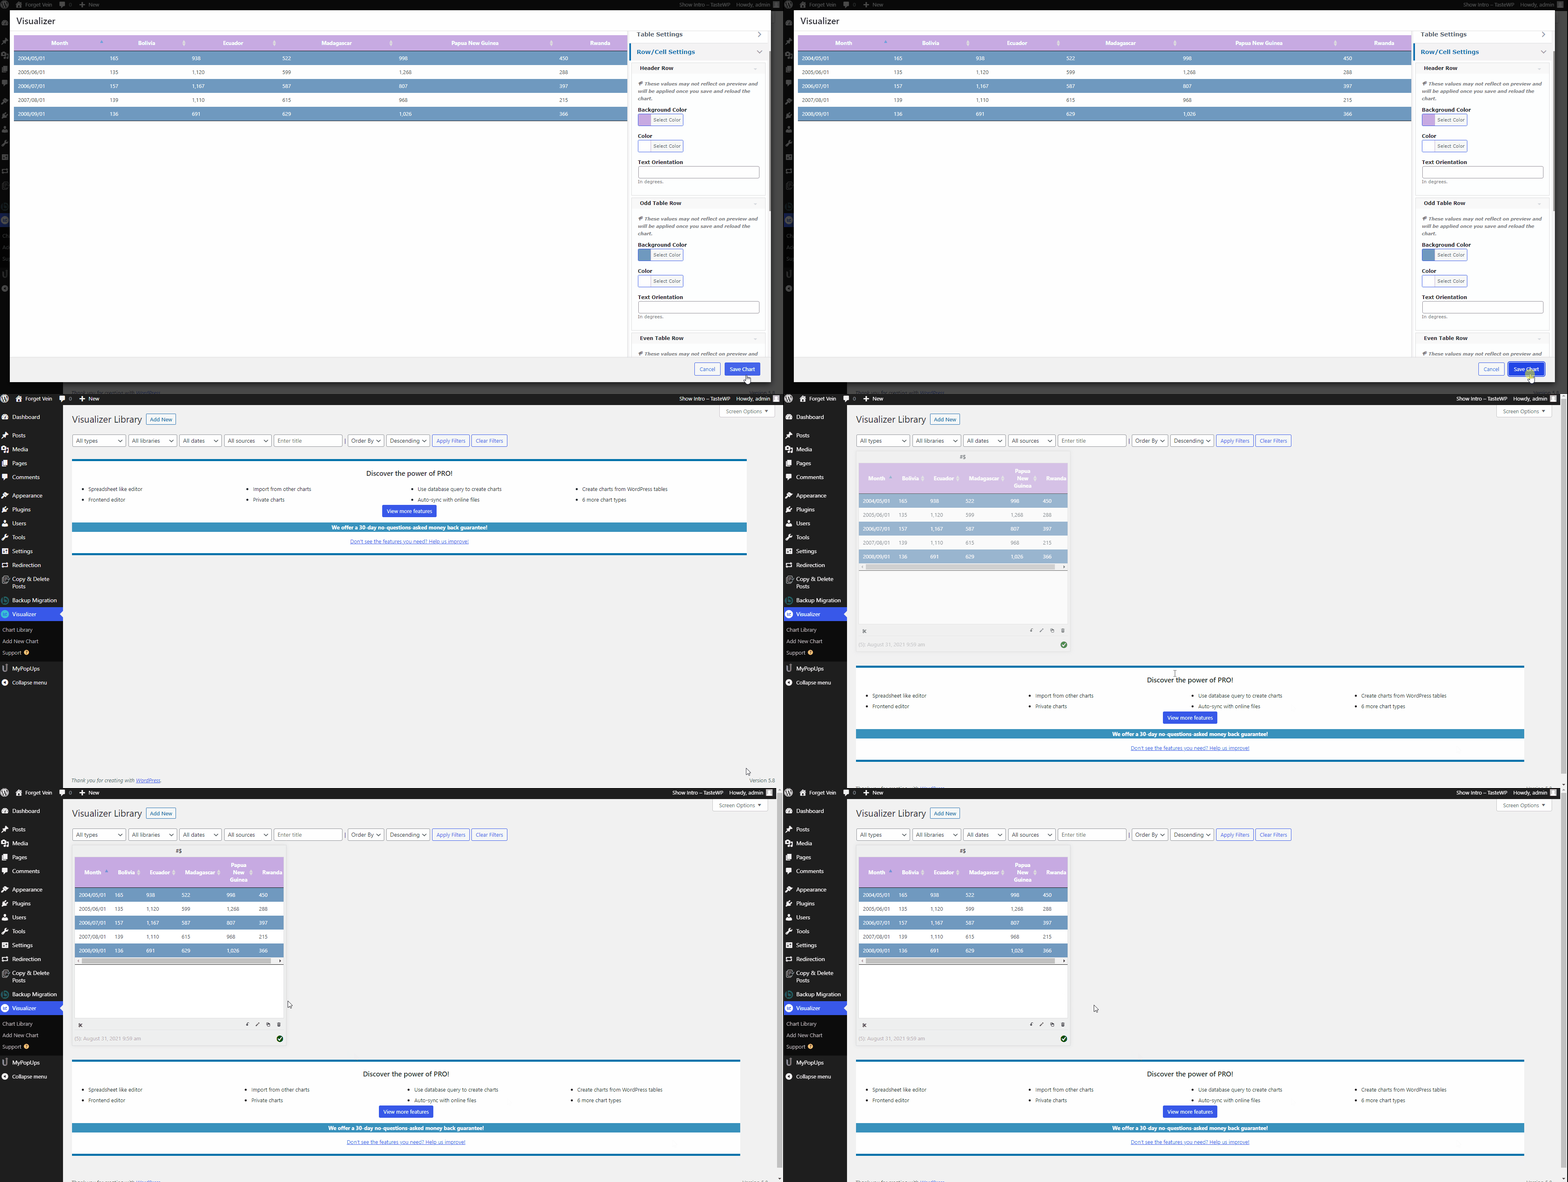
- Even Table Row - these settings will be applied only to the even rows ( pink ).
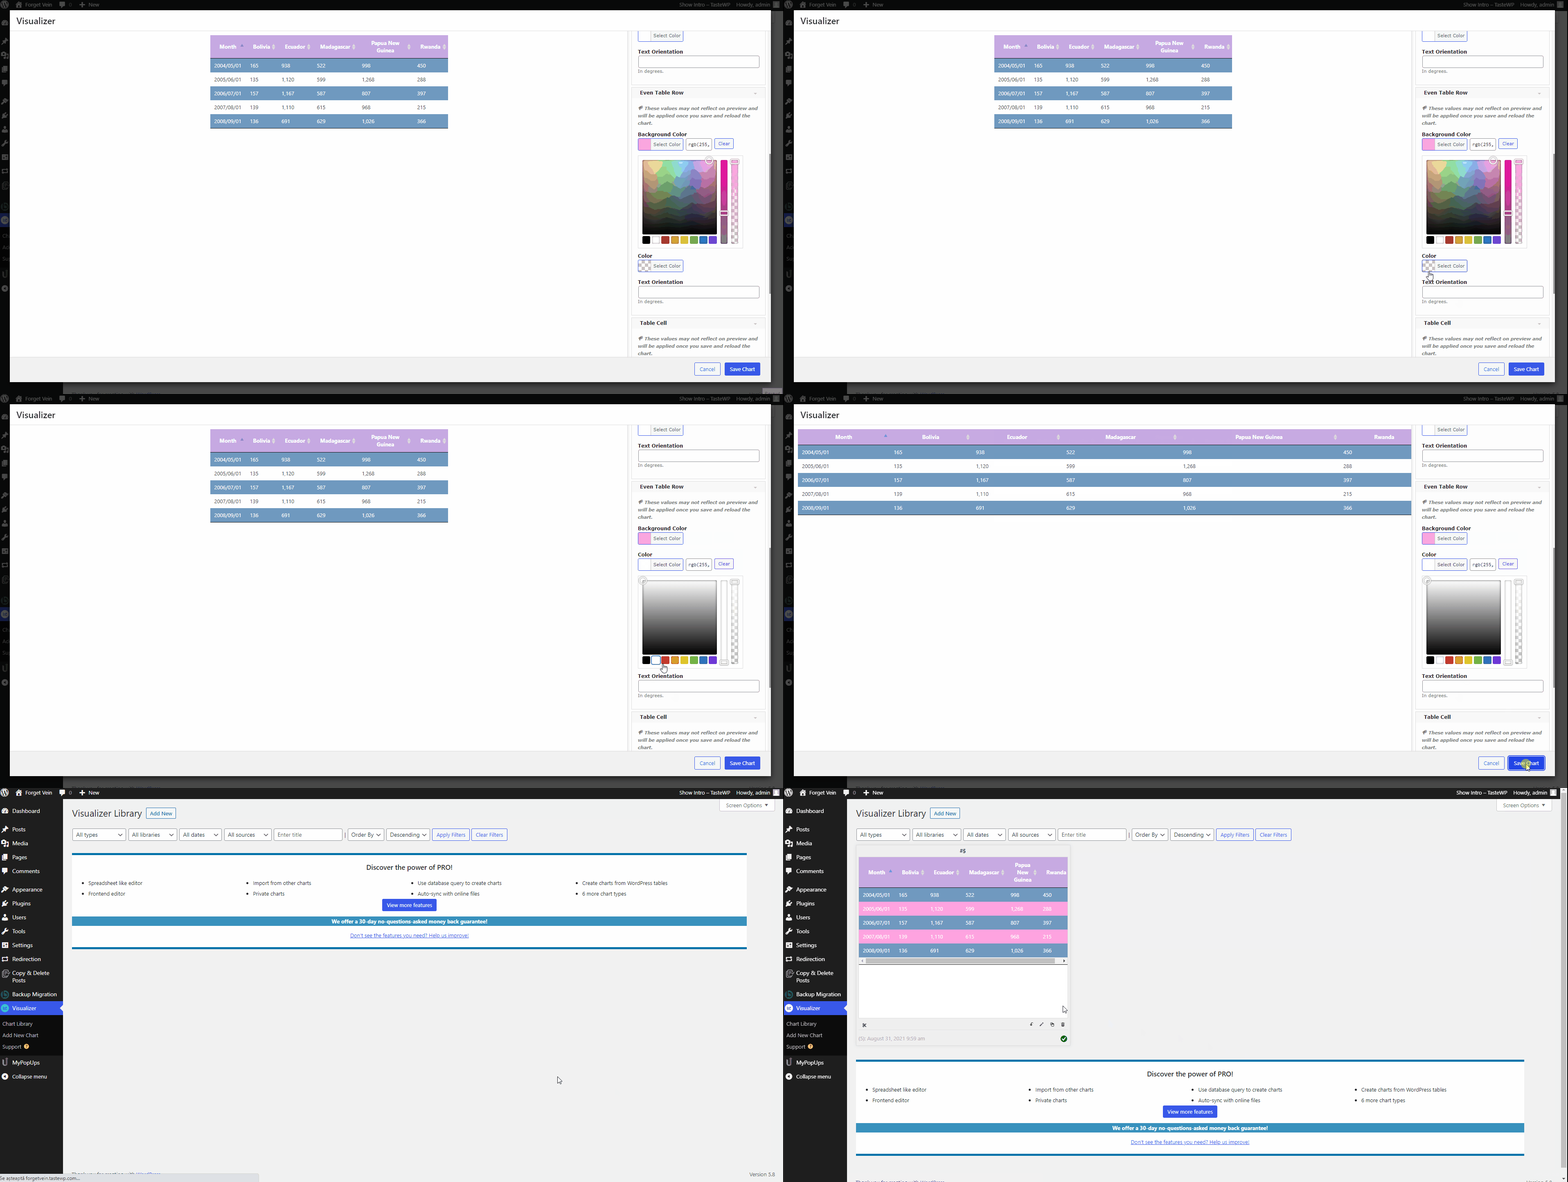
- Table cell - these settings will be applied to the whole table.
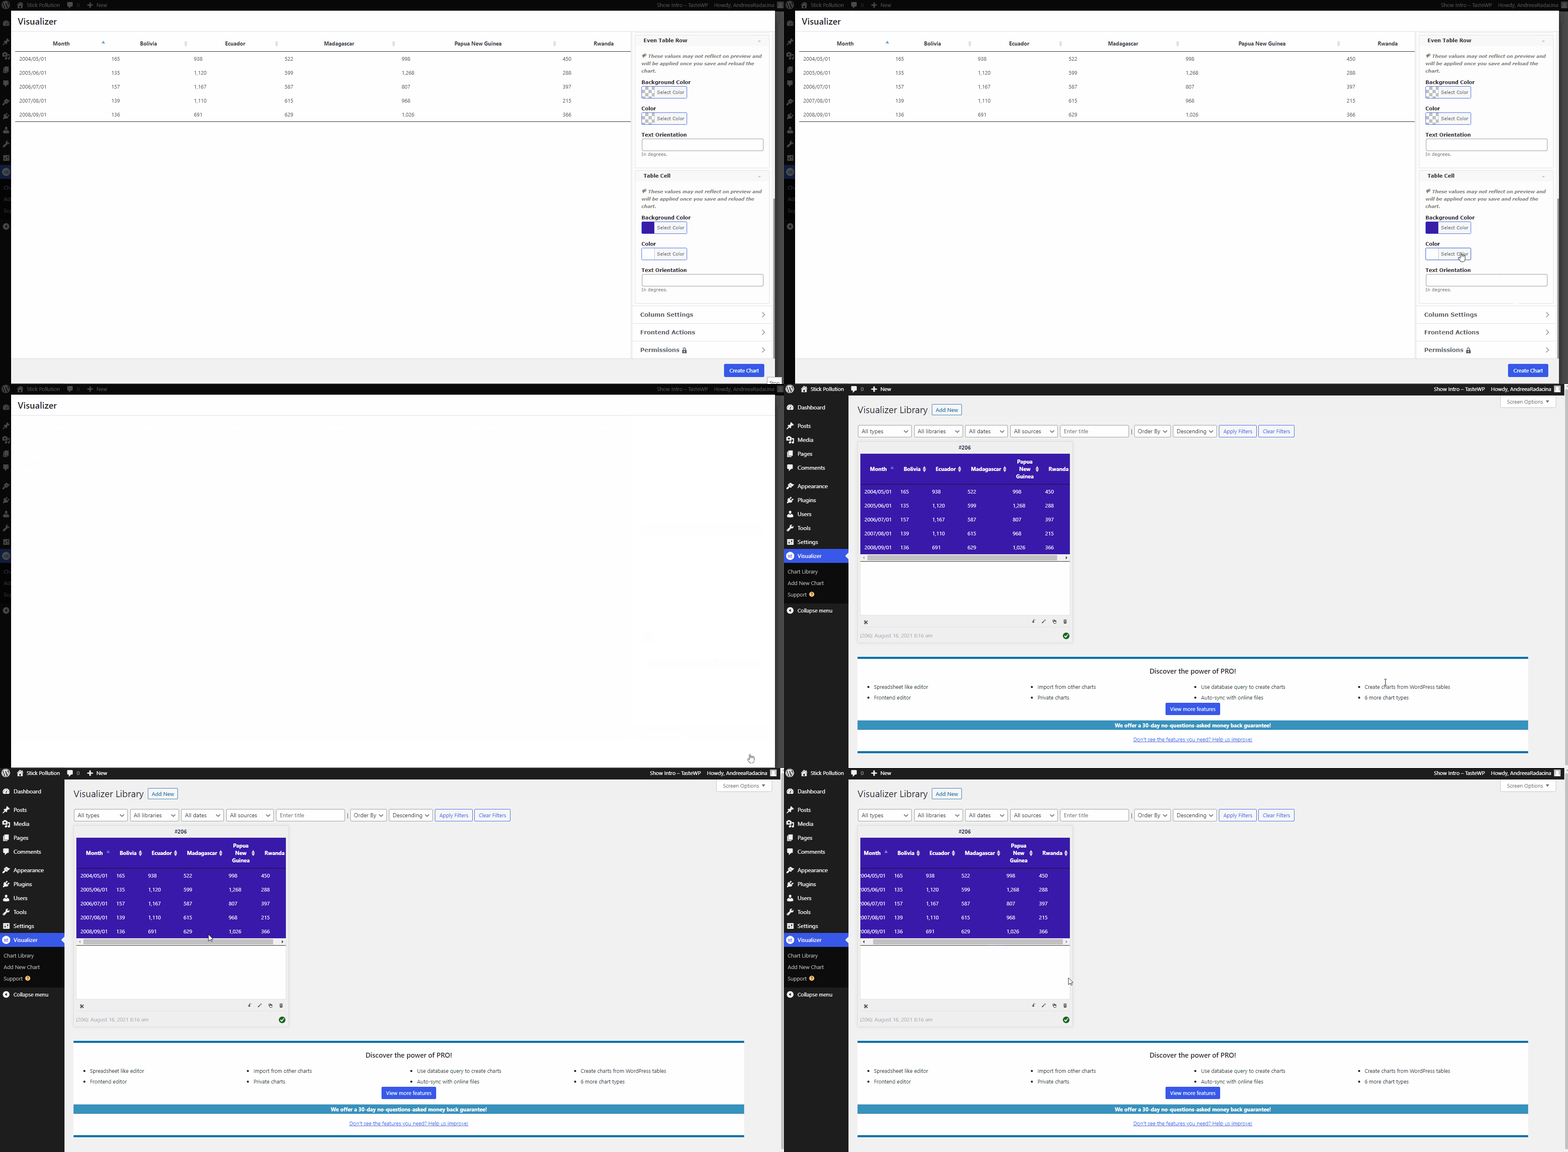
📝 Note: Changes made in this section will not be visible in the preview, they will apply only after Save.
Column Settings
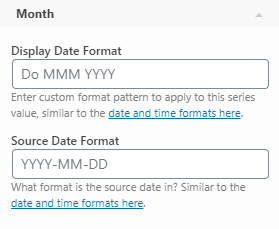
Based on the data type of each column (Date, Number, String) you can edit that column's Appearance and Format.
- for Date - you can change the format:
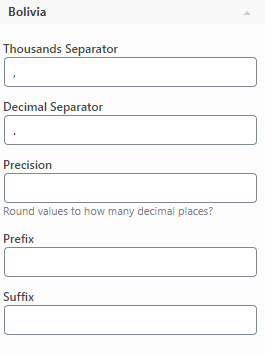
- for numbers - you can change the appearance and the precision:
Frontend actions
You can choose what options to give your visitors to interact with the chart:
- print the chart
- download the data as a CSV
- download the data as an Excel Spreadsheet
- copy the data in the clipboard
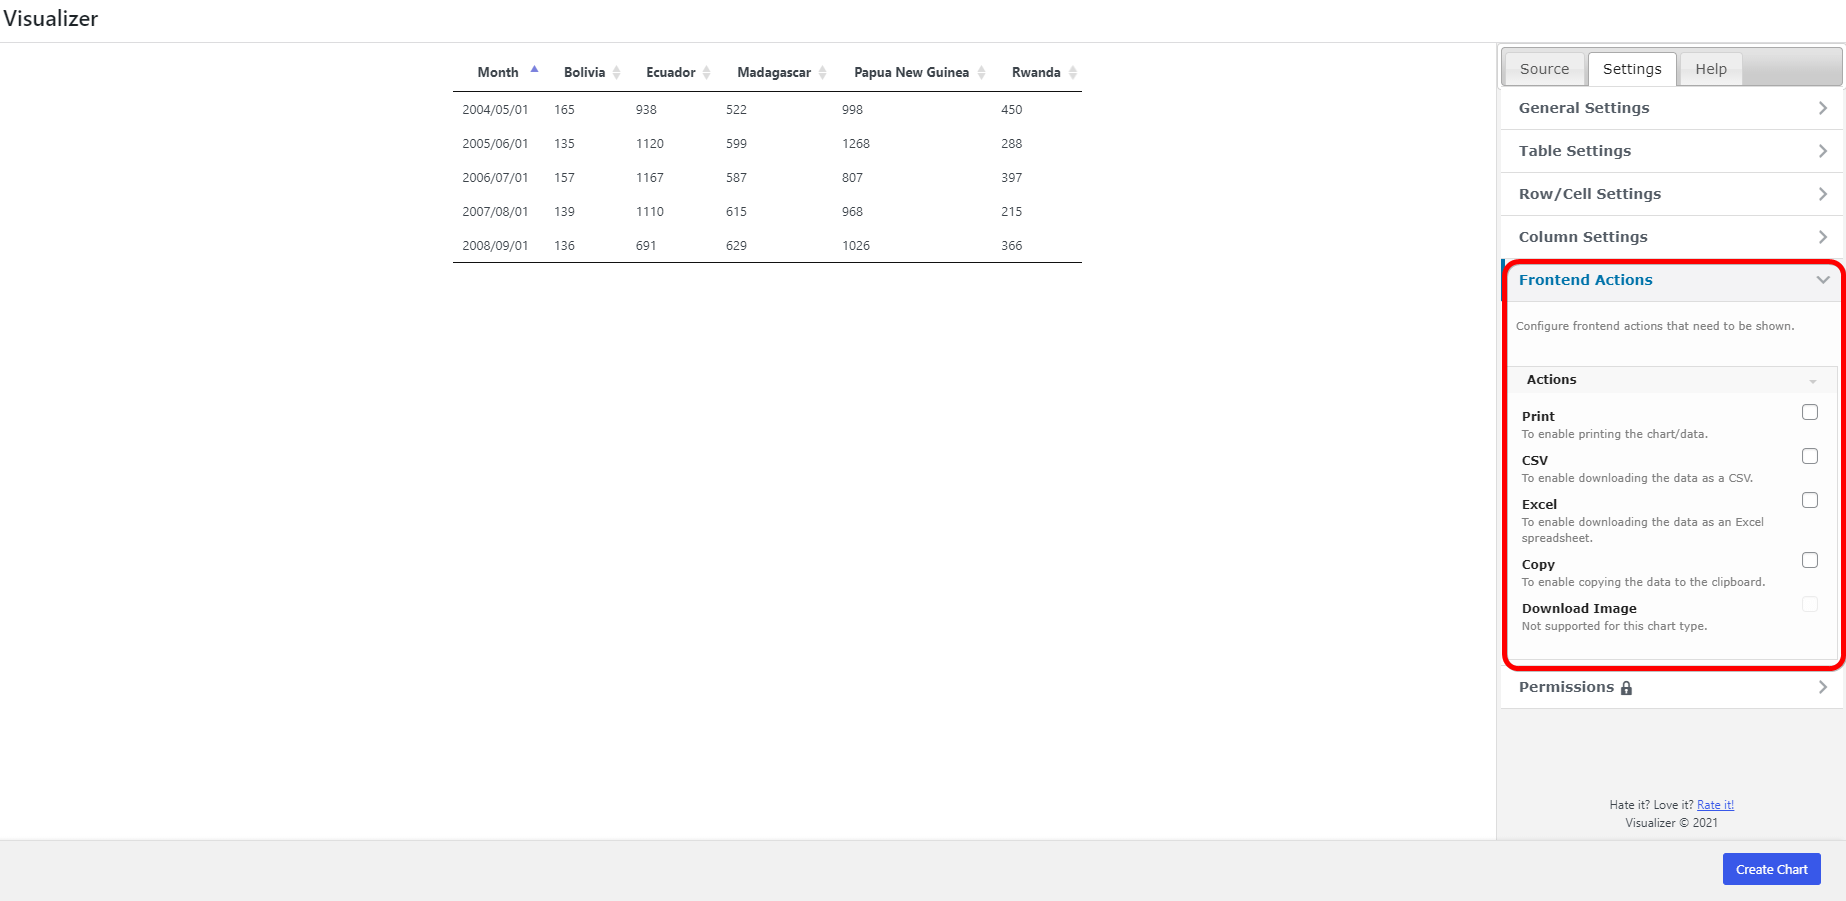
Table Chart Settings - Google Charts
| General Settings | Table Settings | |
| Chart Size & Placement | Frontend Actions | |
| Row / Cell Settings | Series Settings | |
| Manual Configuration |
General Settings
This panel is separated into two others:
- Title
- License & Creator
- License - type the License name.
- Creator - type the Creator name.
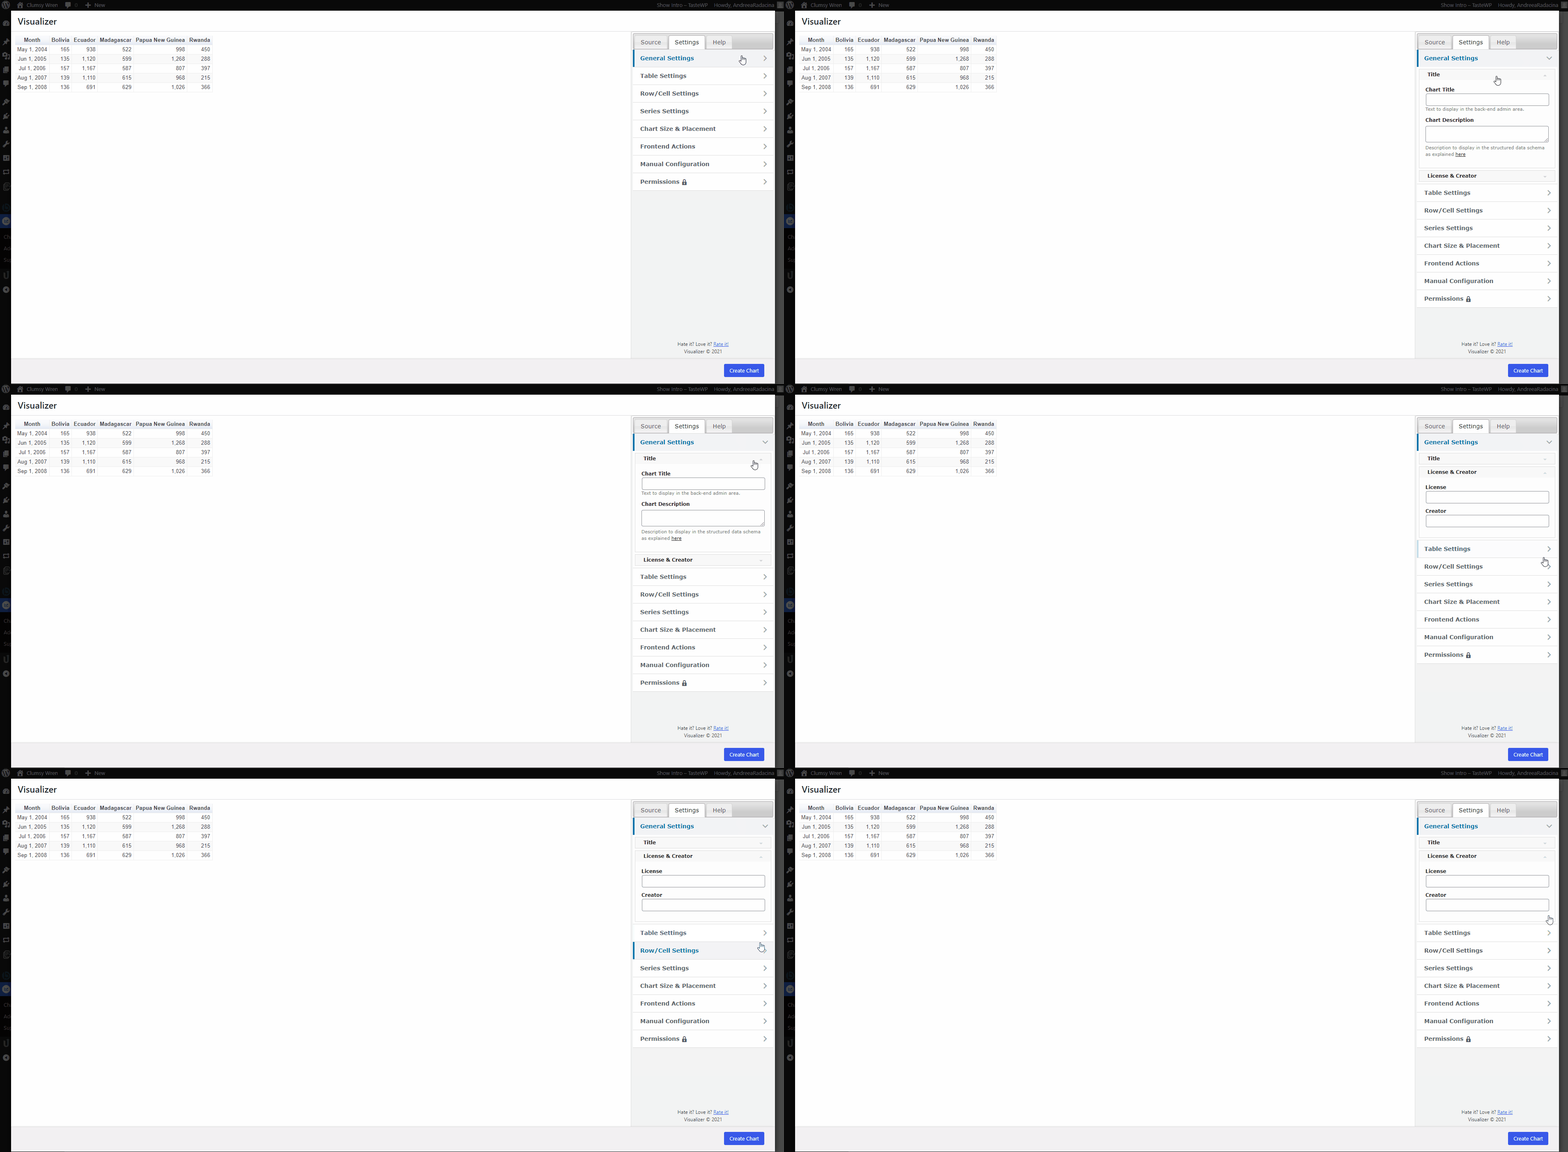
Table Settings
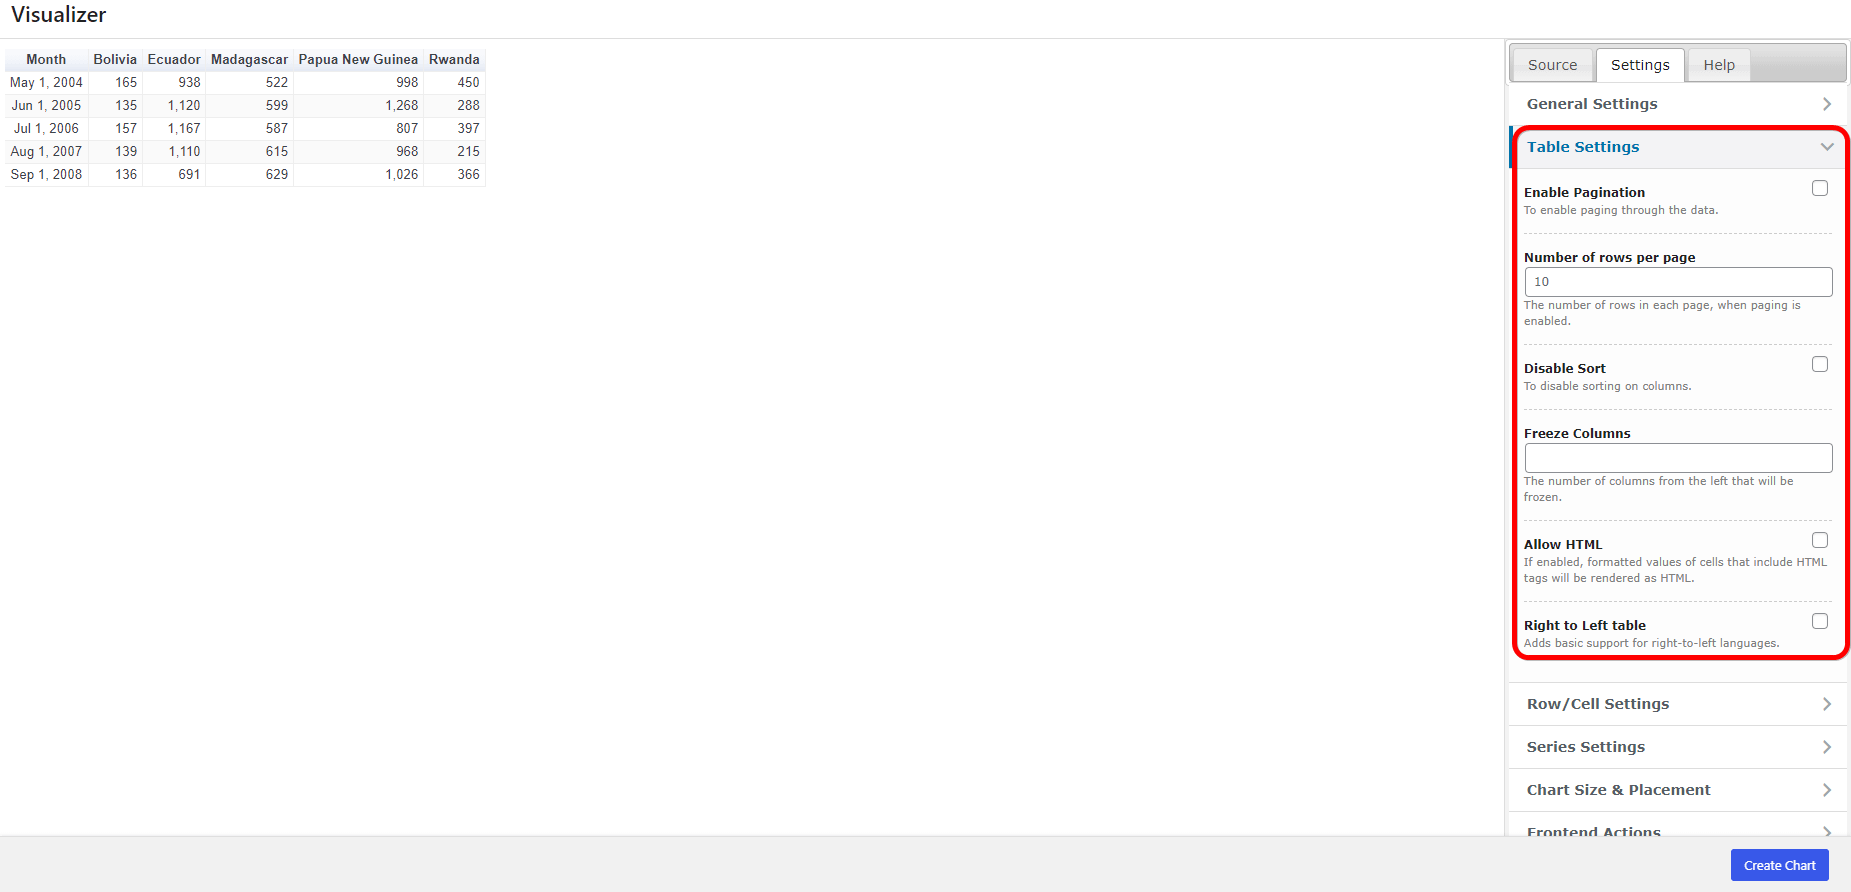
This panel contains the following settings:
- Enable Pagination - enable/ disable.
- Number of rows per page - appears when paging is enabled and establishes the number of rows for each page.
- Disable Sort - by default, charts have a sorting mechanism for each column ( the little arrows near each column heading ). This option allows for disabling the sorting feature.
- Freeze Columns - enter the number of columns from the left that should stay visible when scrolling horizontally.
- Allow HTML - it will render as HTML the formatted values that include HTML tags.
- Right to Left table - adds basic support for right-to-left languages.
Row/Cell Settings
In this panel are available three types of settings:
- Background color
- Color
- Text Orientation (in degrees)
These settings can be applied in seven areas:
- Header Row - will be applied to the whole row, not on individual cells.
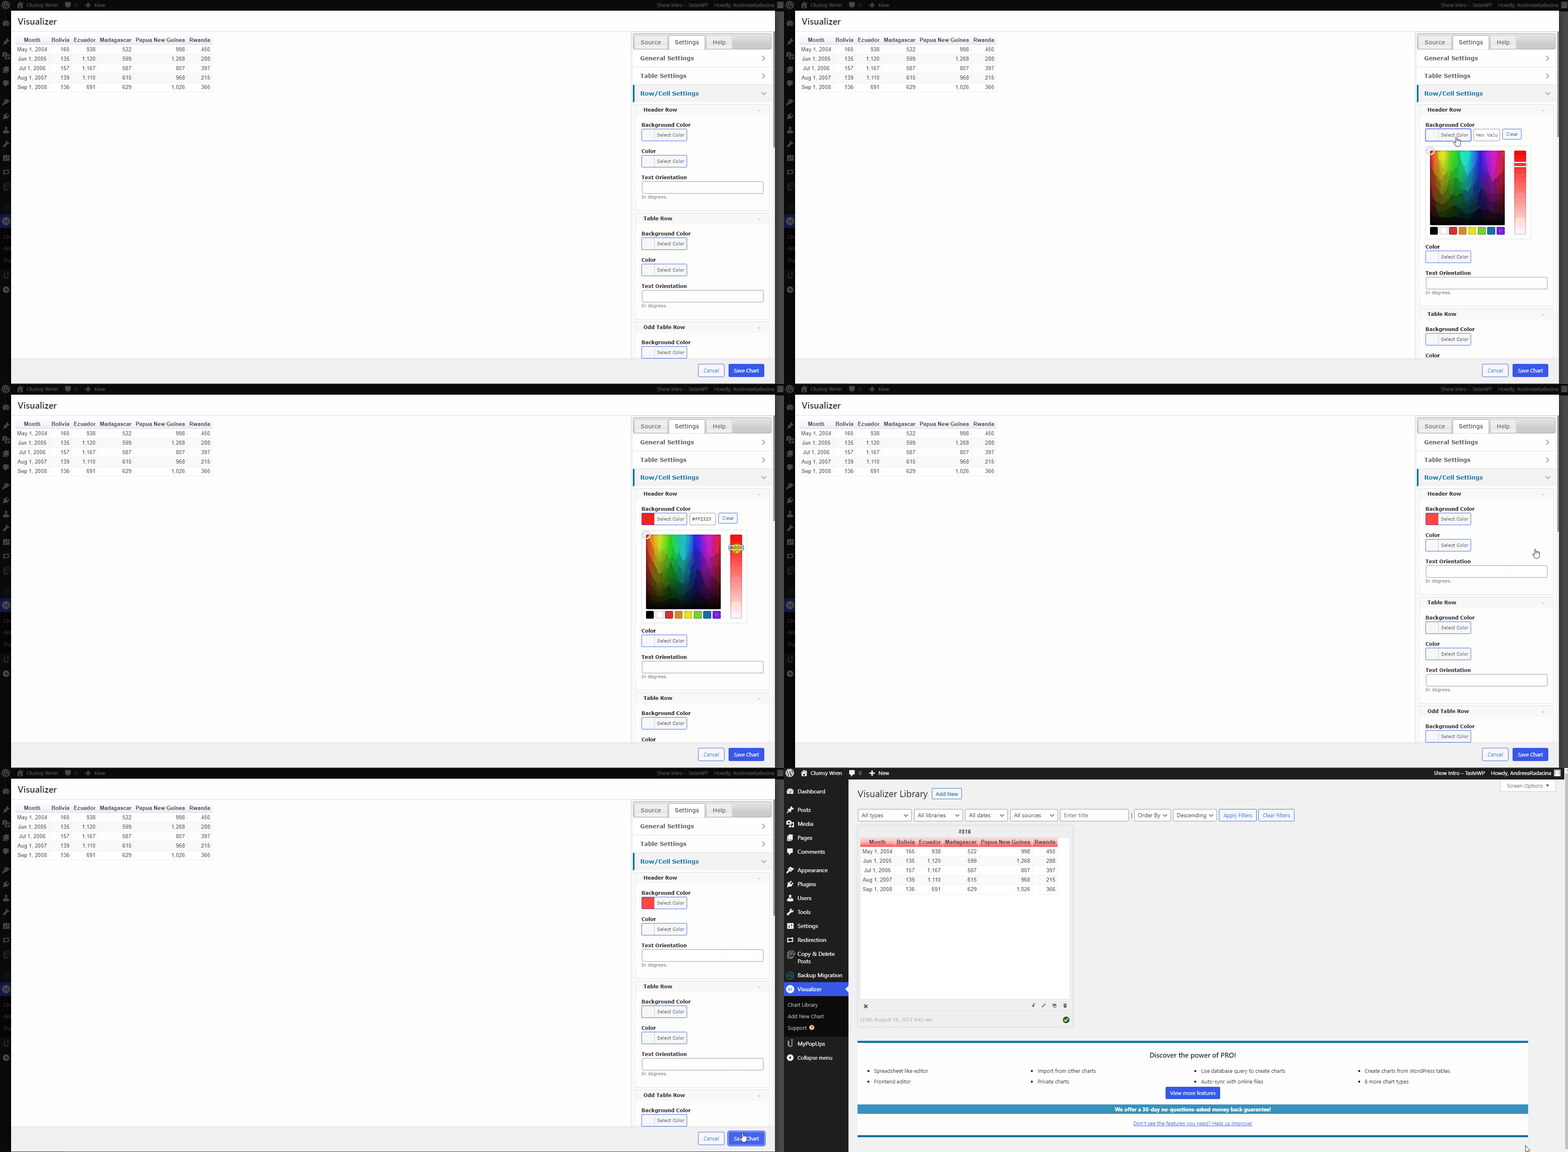
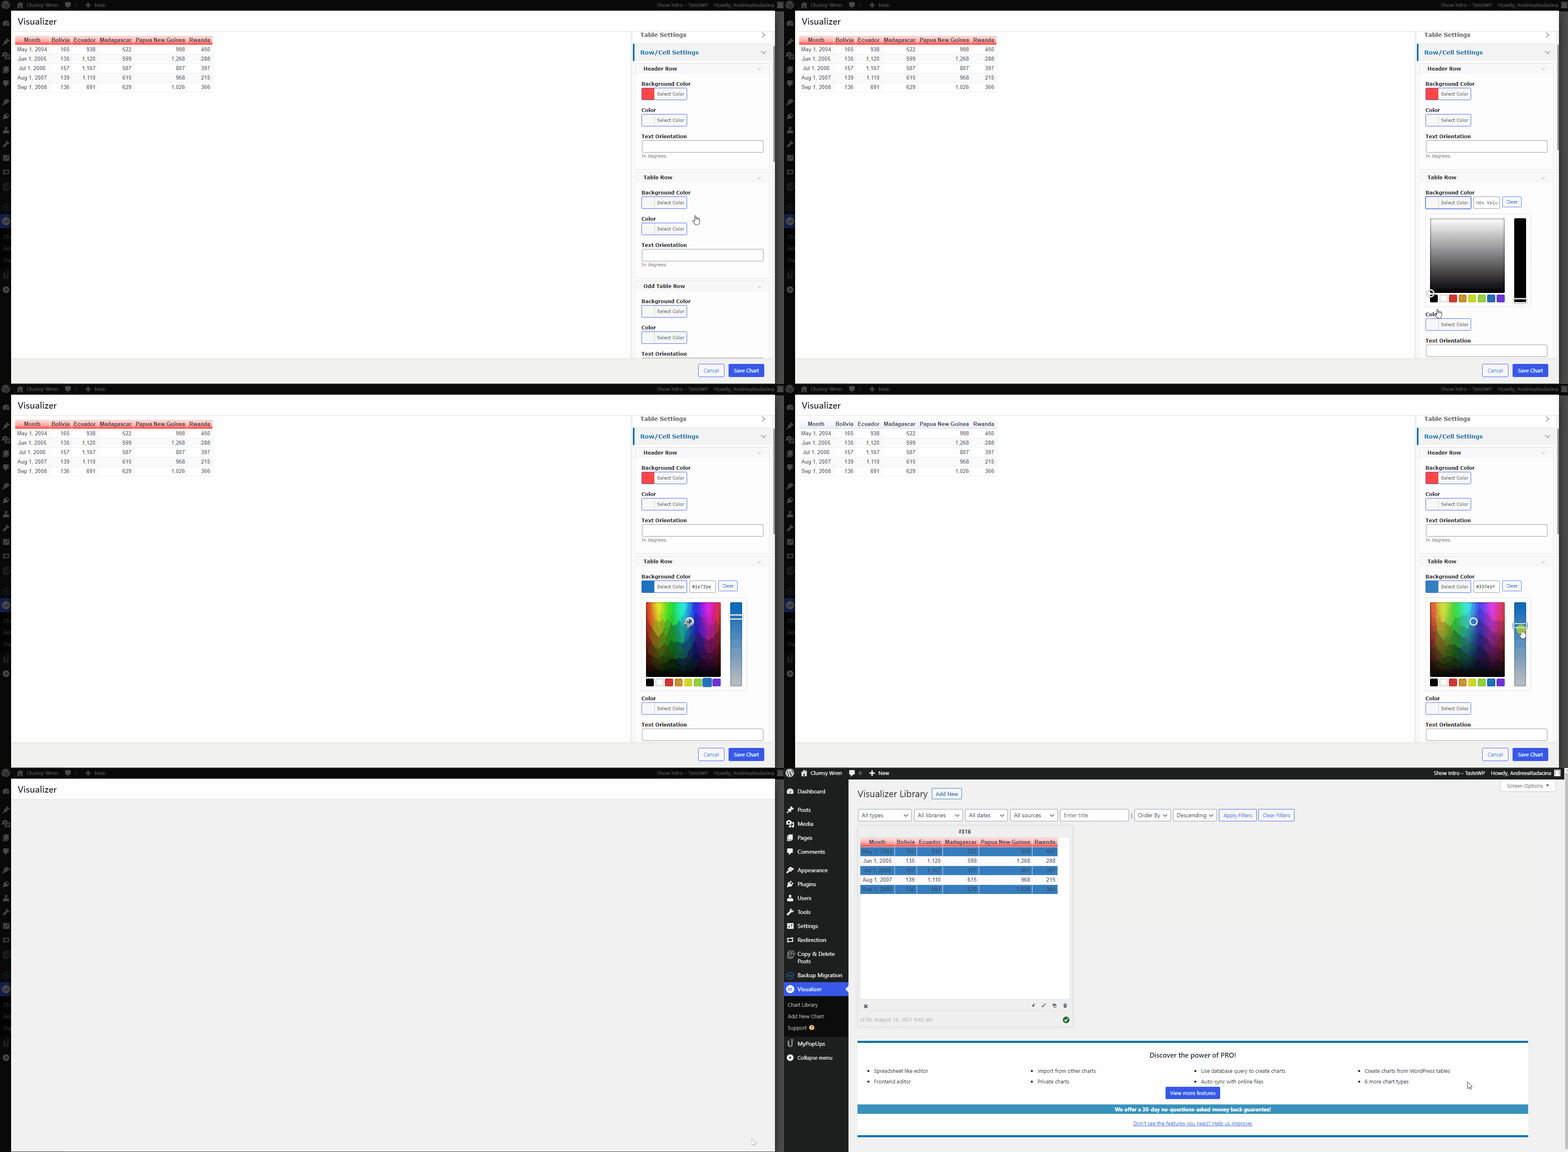
- Table Row - will be applied to the table rows only, to the even ones.
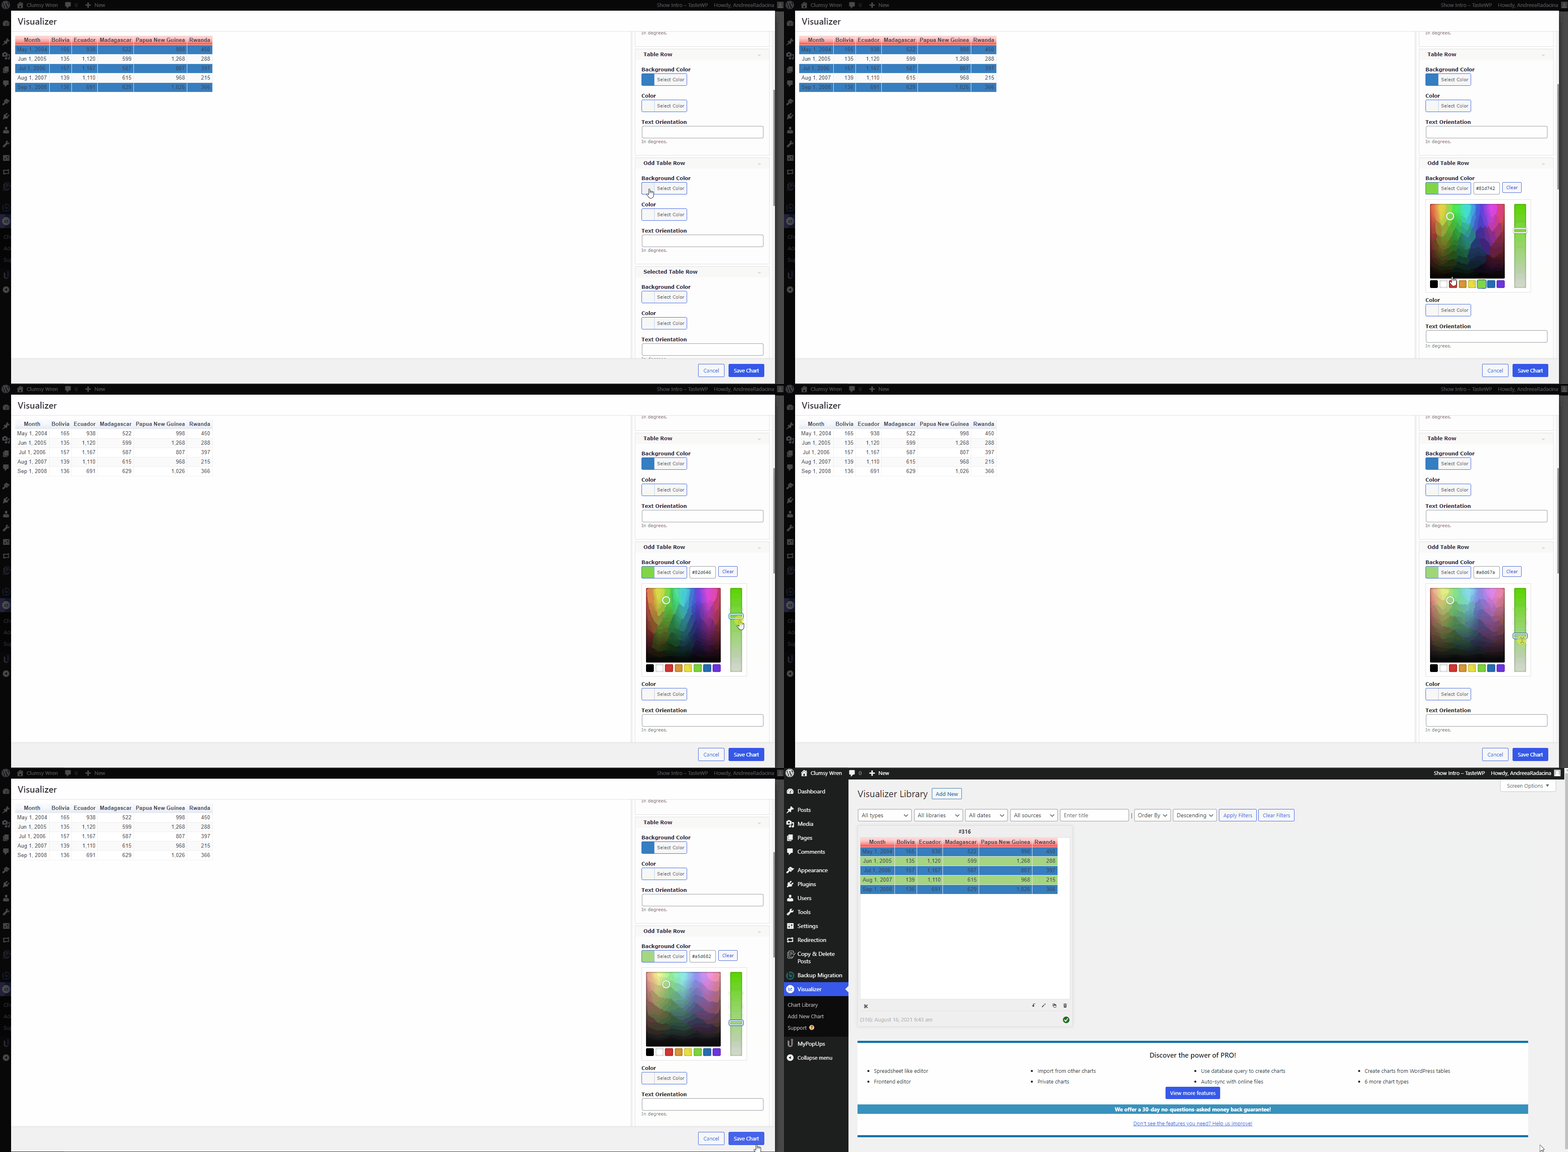
- Odd Table Row - will be applied to the table's odd rows.
- Selected Table Row - will appear when you select a certain field.
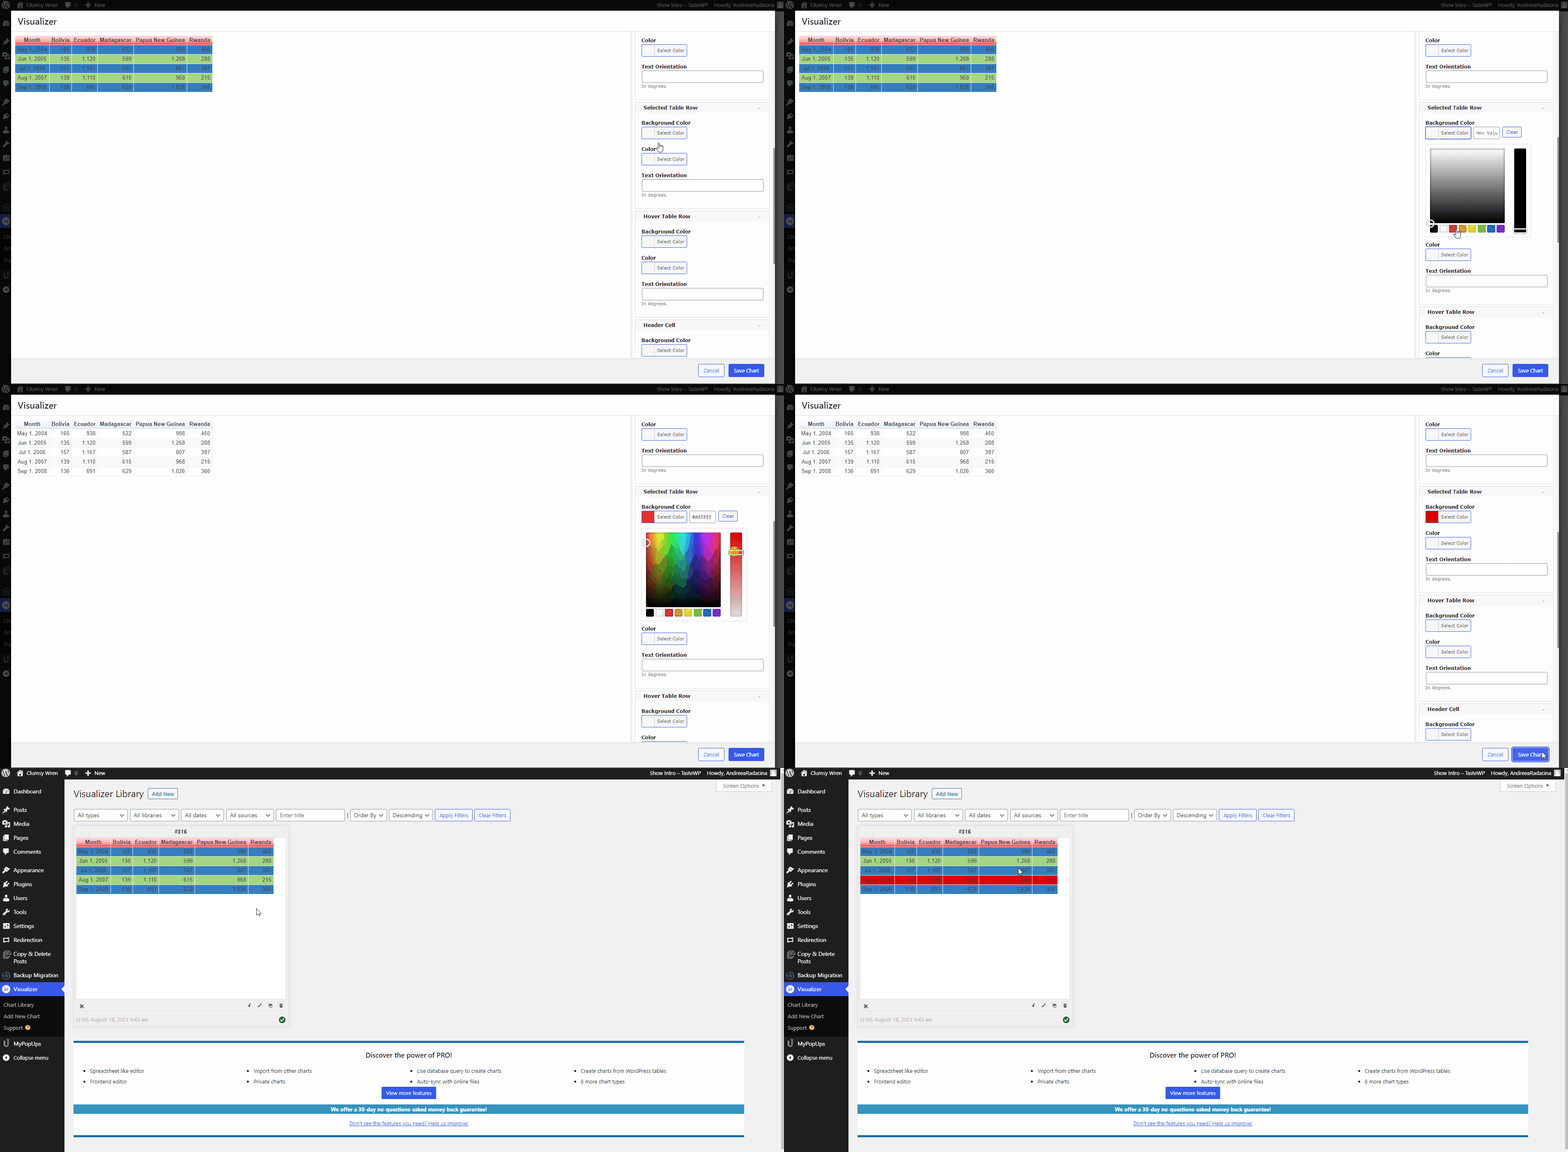
- Hover Table Row - will appear when you hove with the mouse.
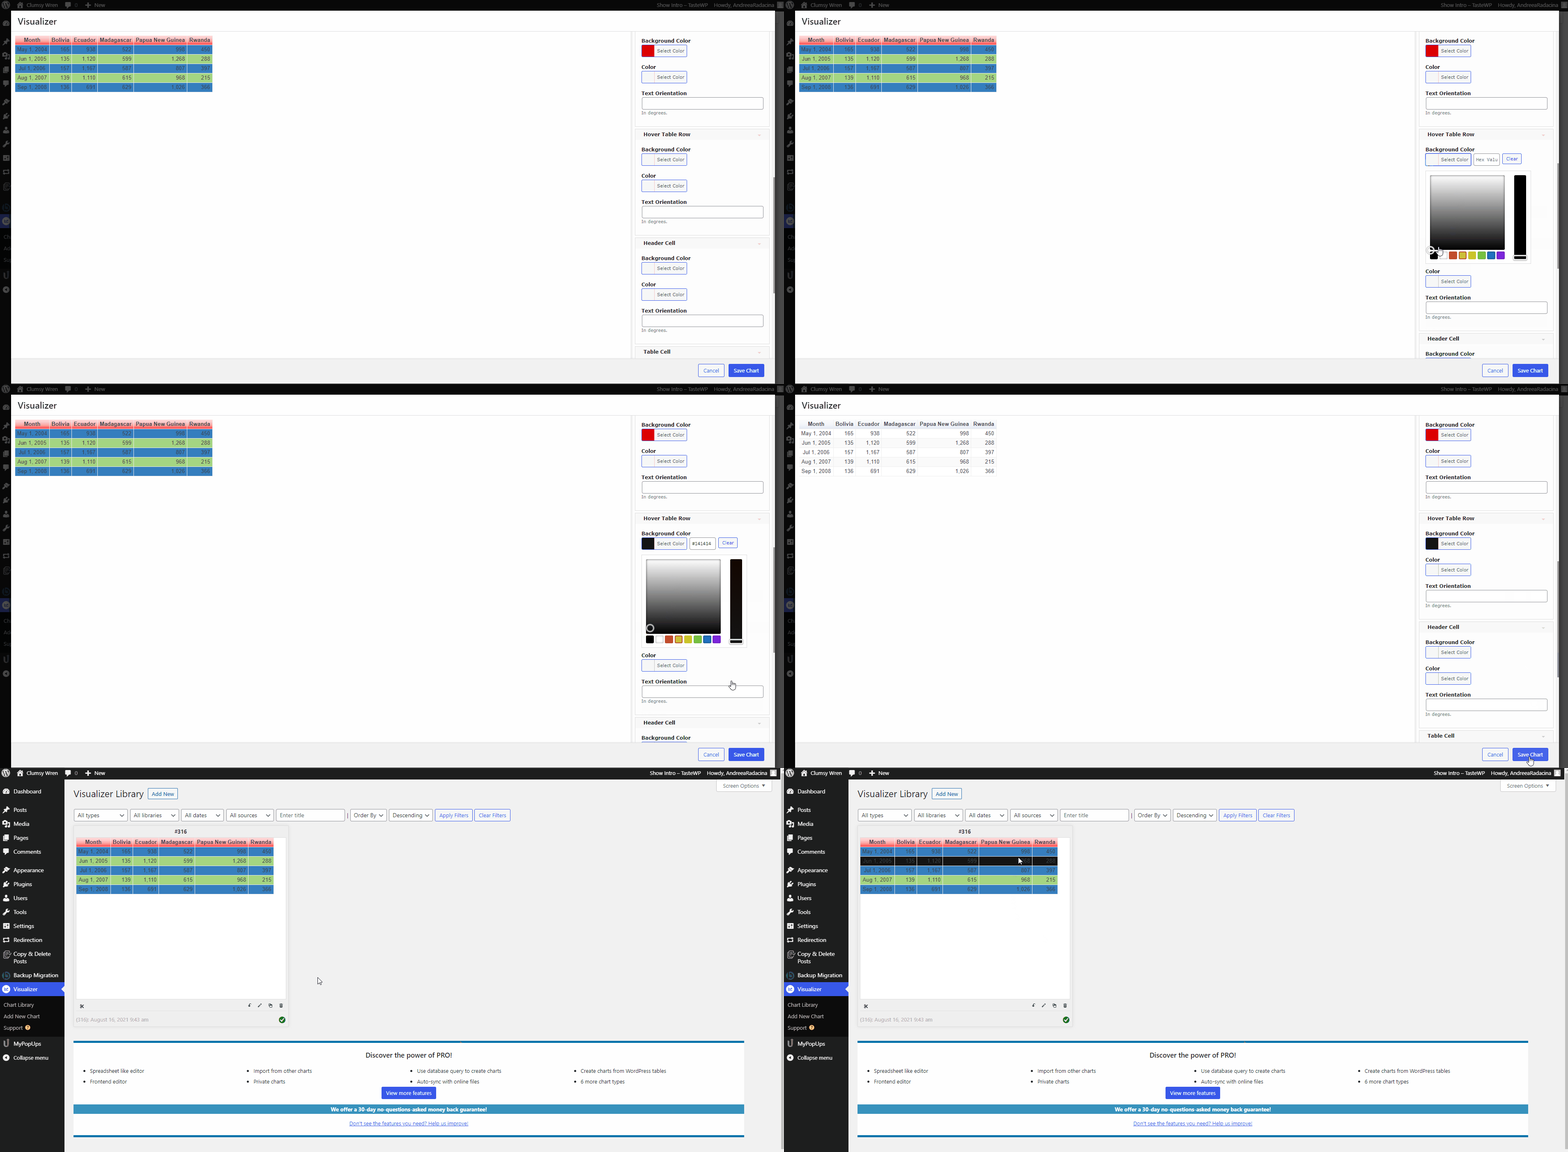
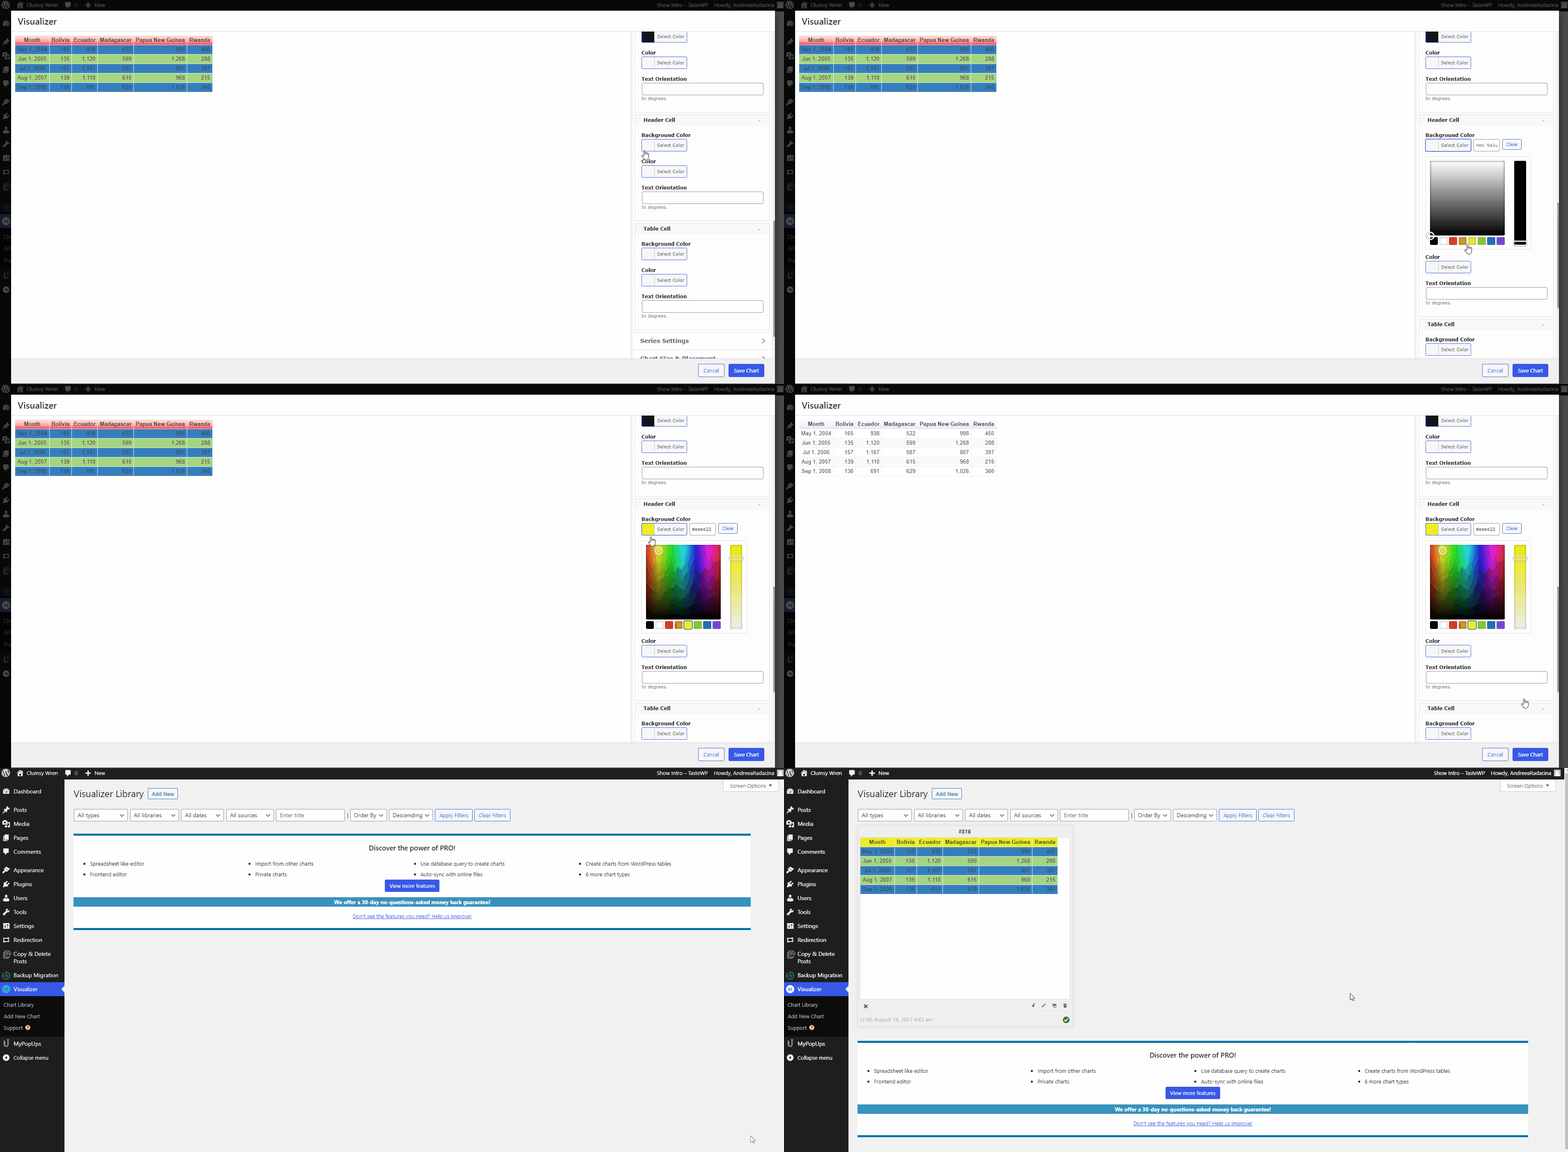
- Header Cell - will change the color of every individual header cell (you can notice the difference between header cell and header row if you modify the text orientation).
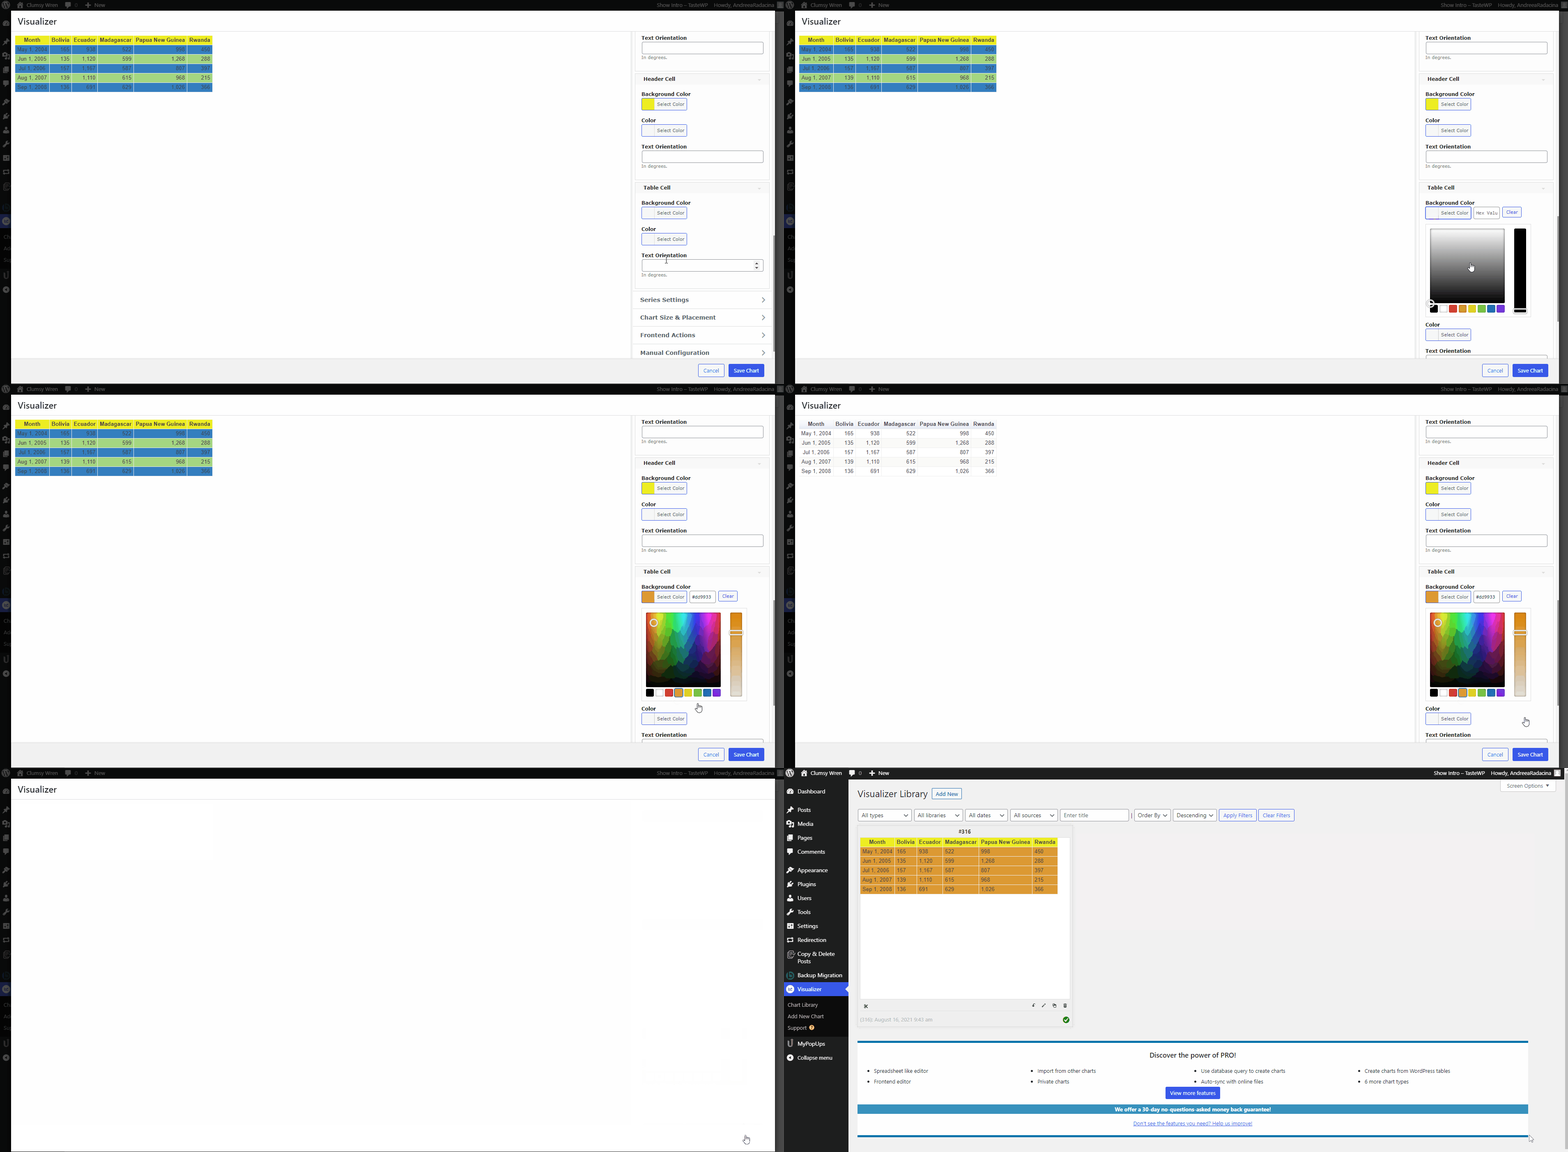
- Table Cell - will modify the colors of every individual cell of the table.
Series Settings
These settings can be applied to every column of the table and imply the number format - how many numbers are in front/after the comma, digits settings, etc.
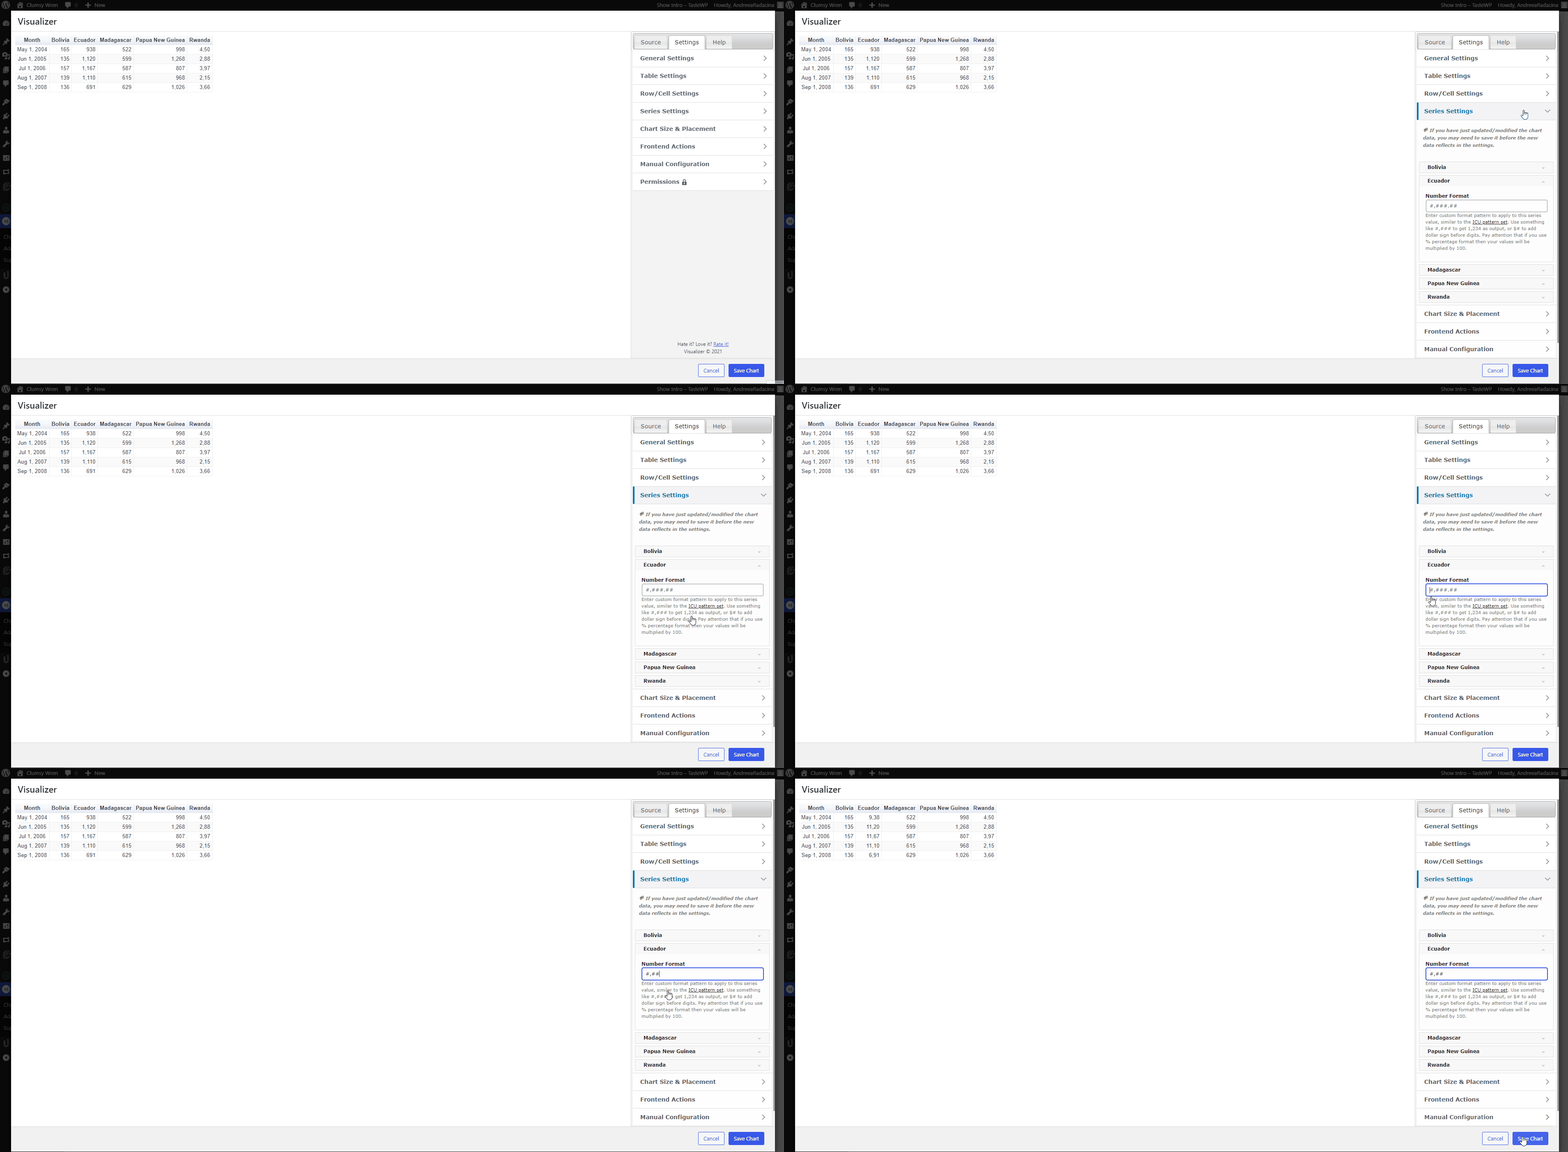
Chart Size & Placement
This panel contains two accordion options:
- Chart Size/ Layout
- Width and Height of Chart - determines the whole dimension of the chart, which will appear on the front-end.
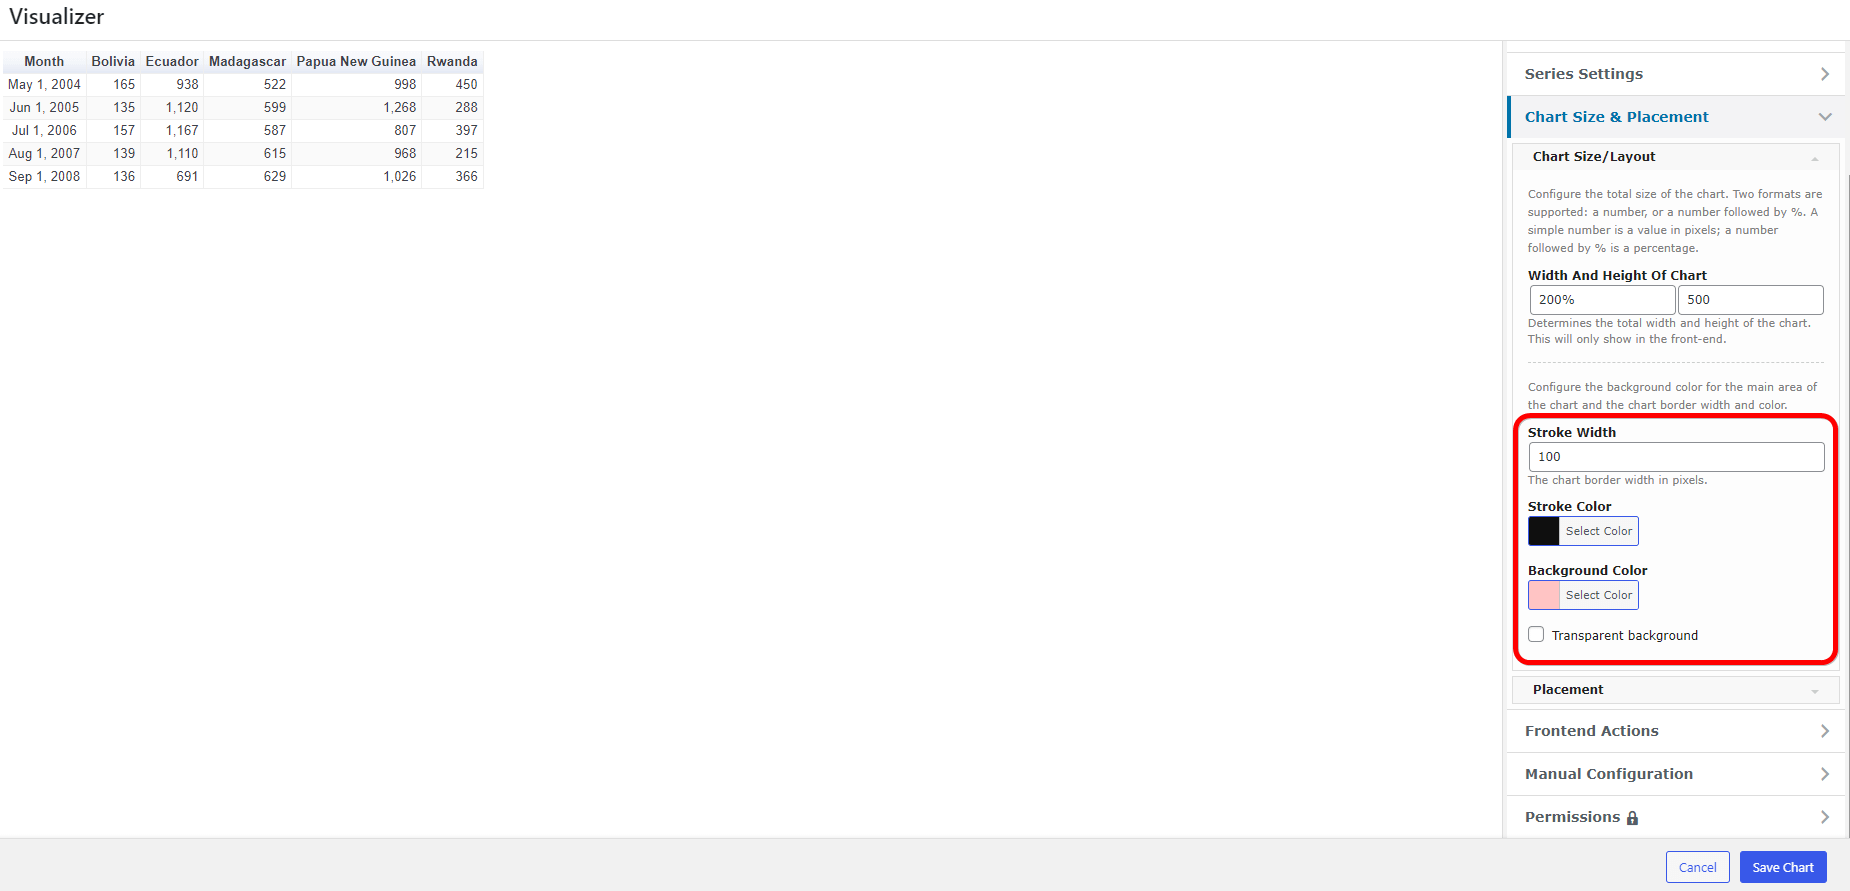
- Stroke width - the width of the chart's border, in pixels.
- Stroke Color - the color of the chart's border.
- Background Color
- Transparent Background
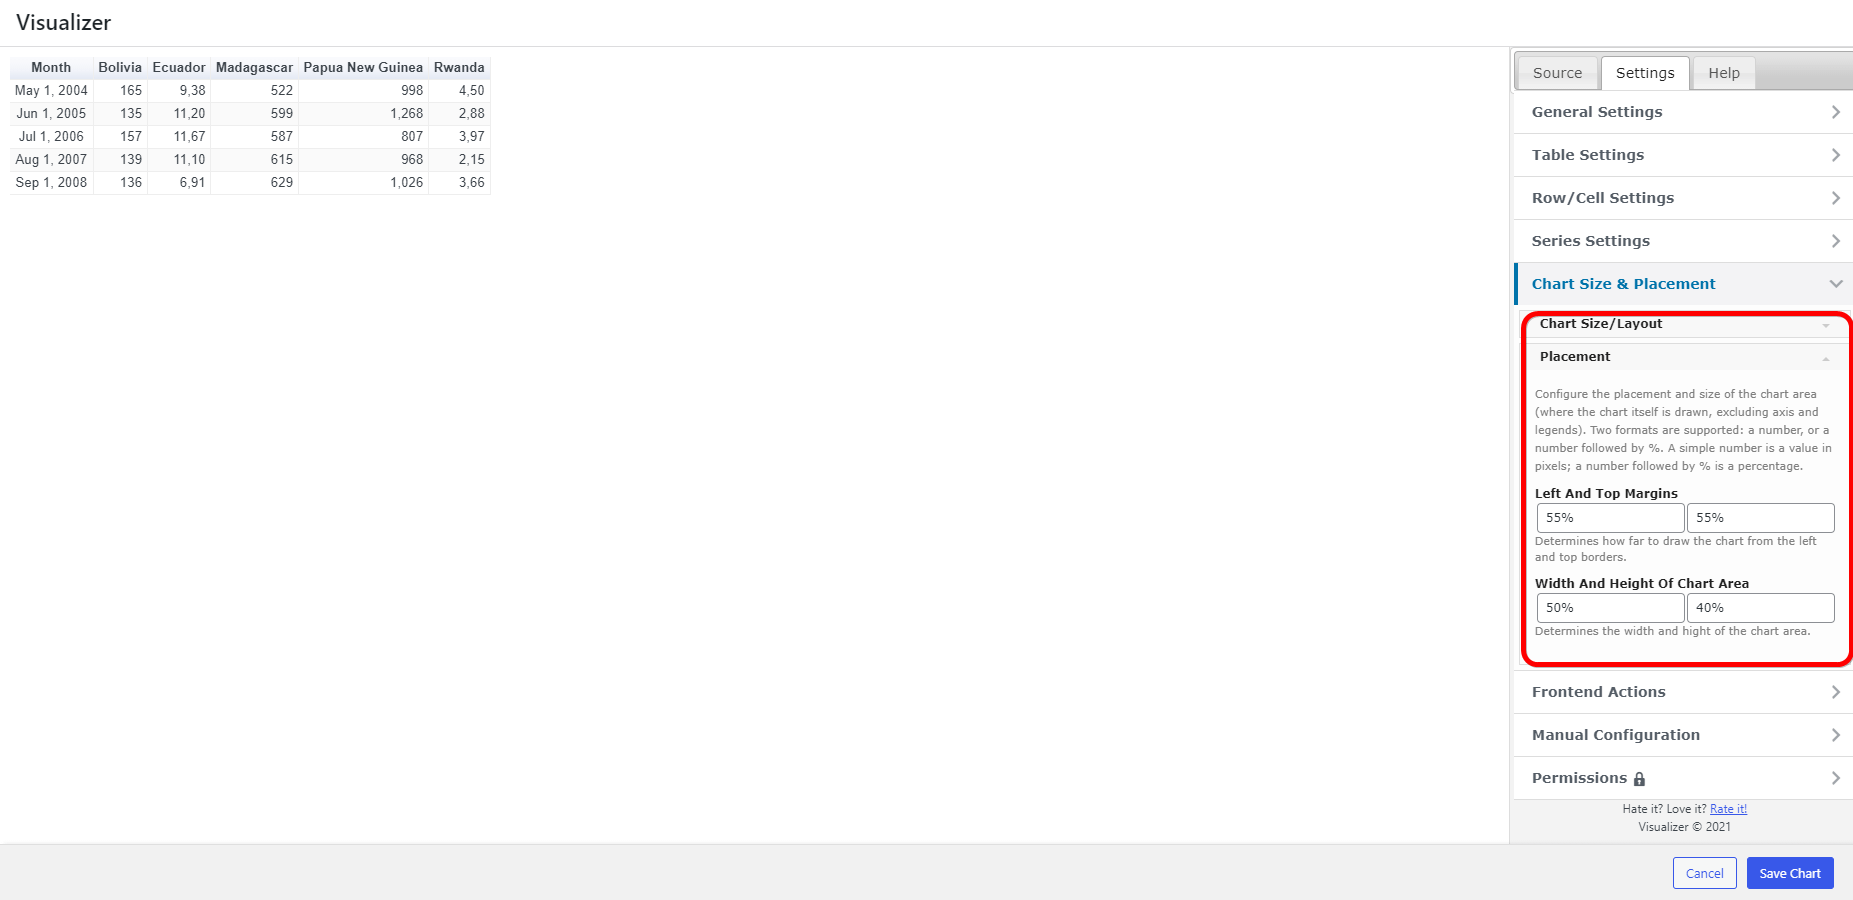
- Placement
- Left and Top Margins - determines how far to draw the chart from the margins.
- Width and Height of chart area - determines the width and height of the chart area.
Frontend Actions
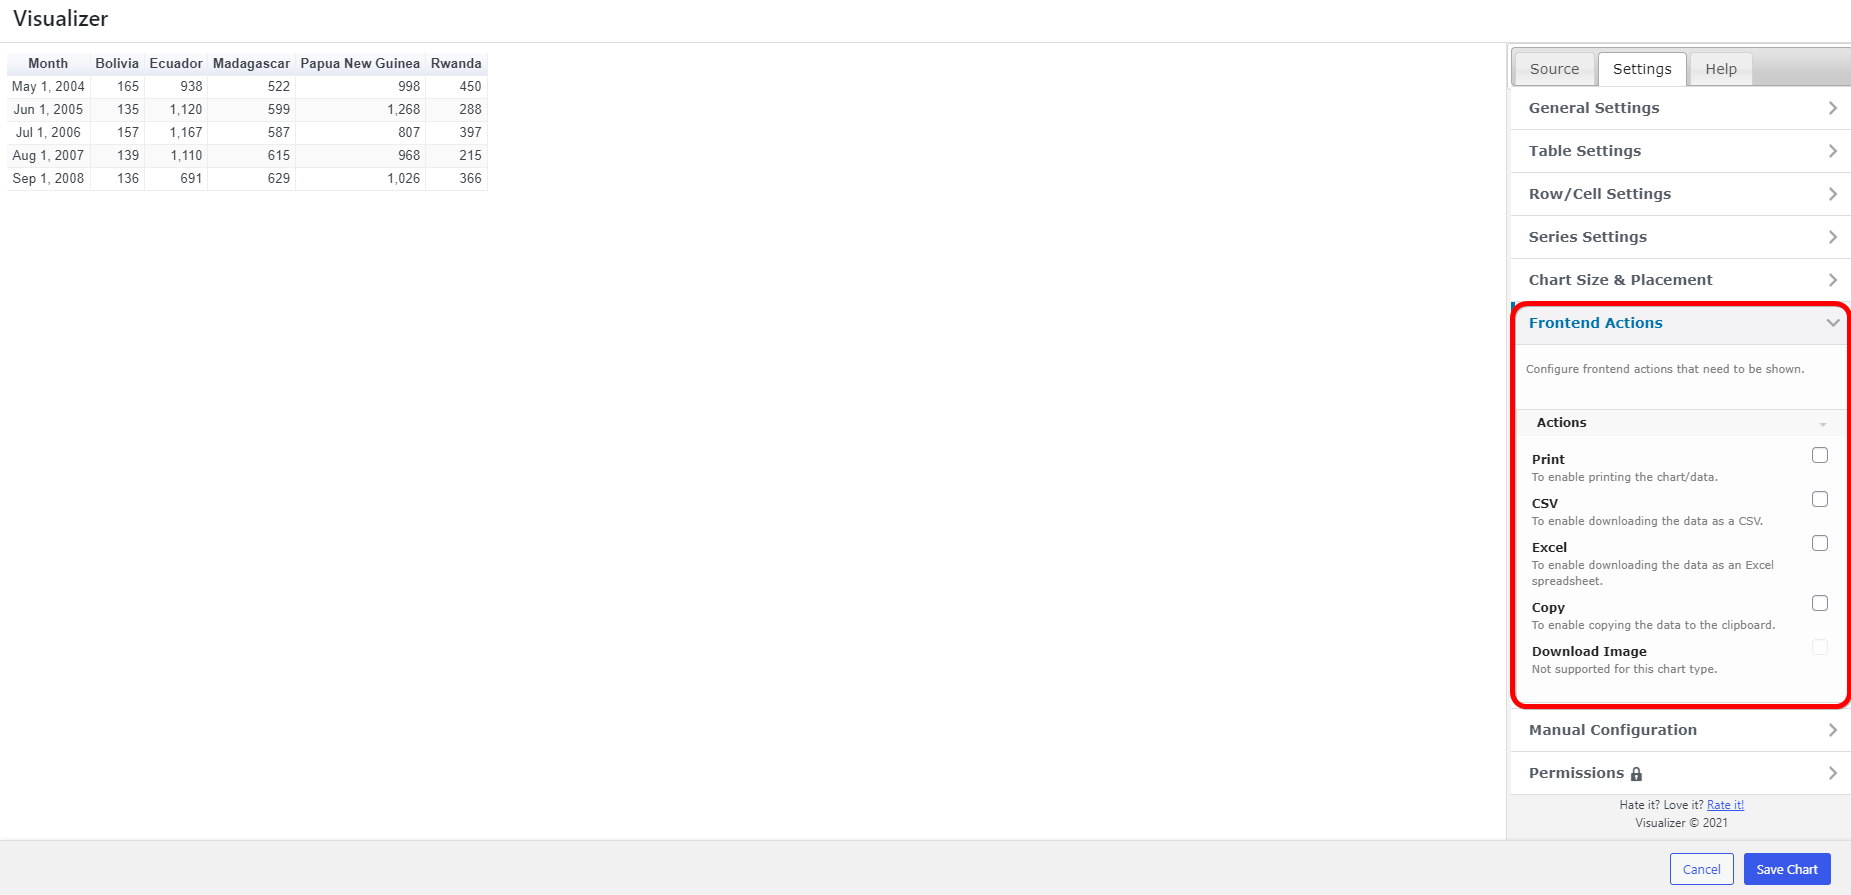
You can choose what options to give your visitors to interact with the chart:
- print the chart
- download the data as a CSV
- download the data as an Excel Spreadsheet
- copy the data in the clipboard
Manual Configuration
This panel allows the user to configure the graph by providing configuration variables.
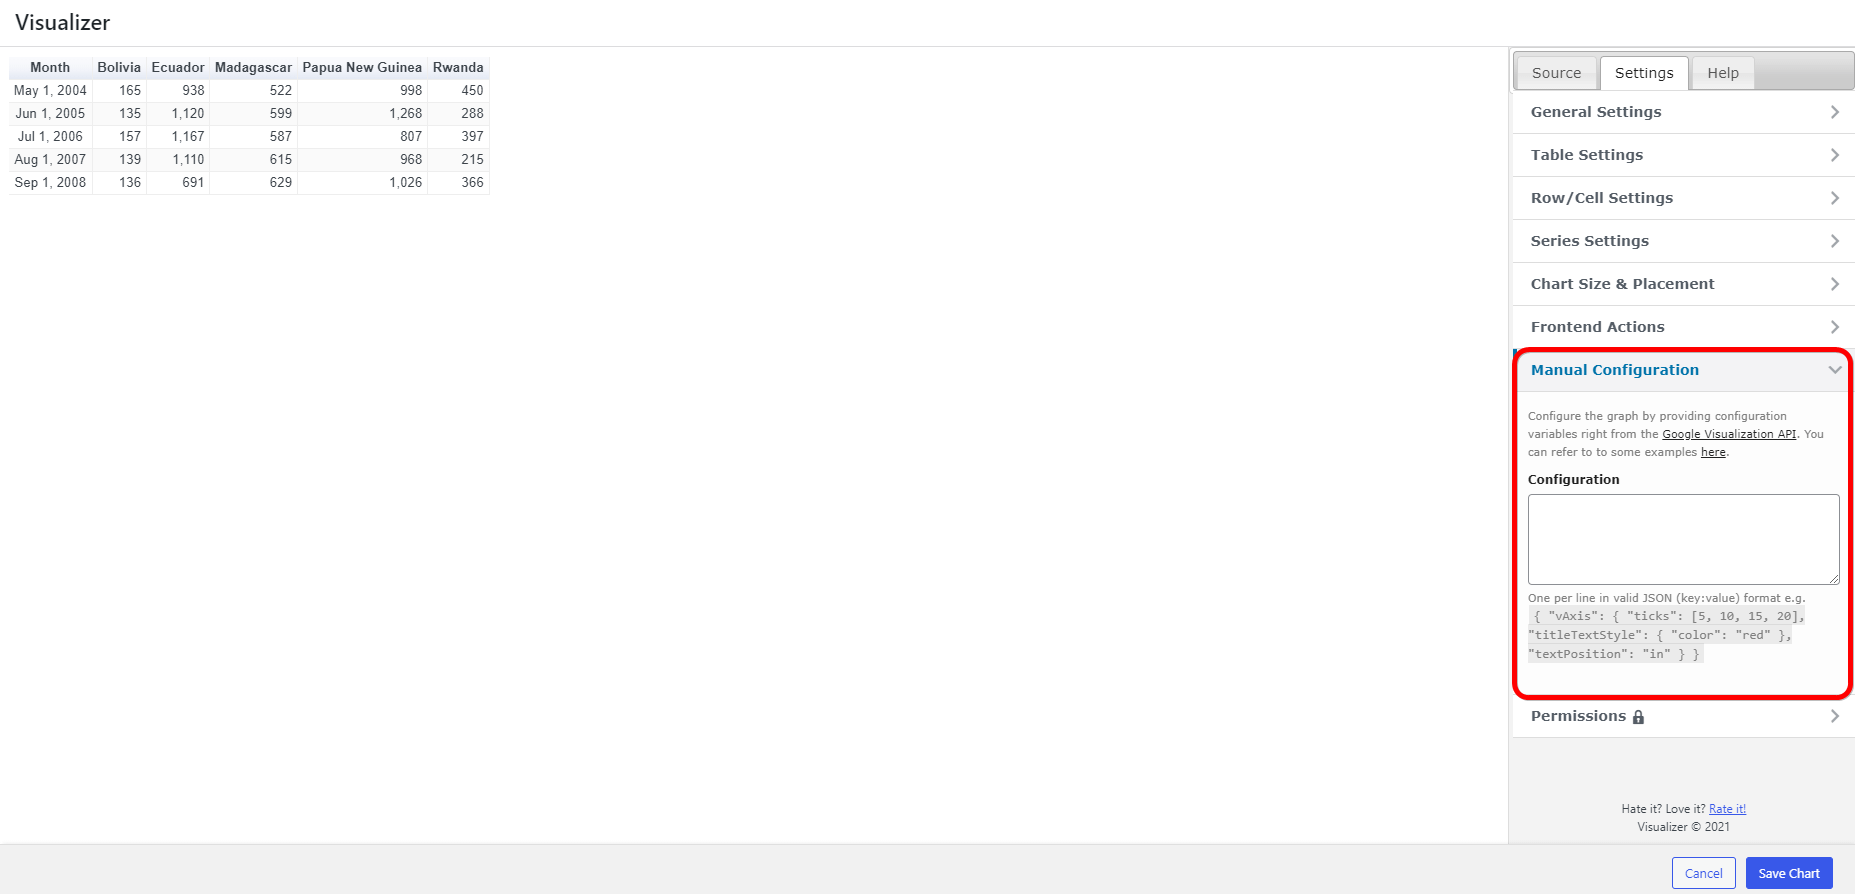
📝 Note: You can find more information about the manual configuration, following this doc.
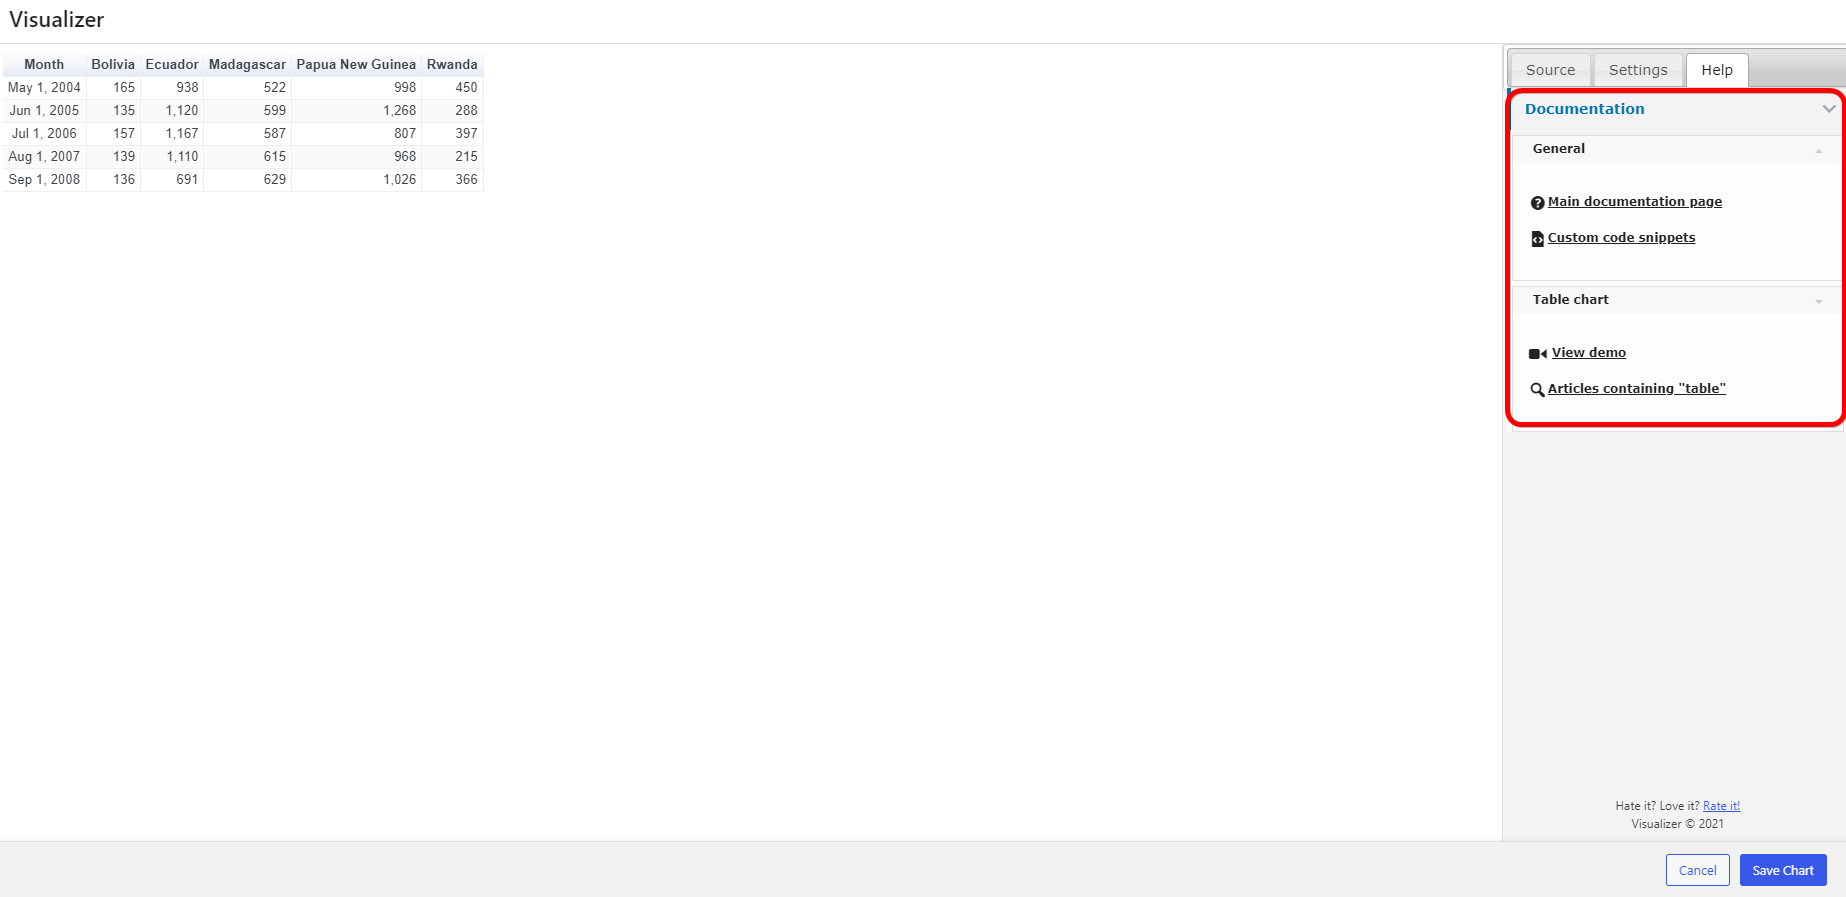
Help
In this area, you have access to more docs created to help with using Visualizer Table Charts, to custom code snippets, and also to video tutorials.