How to display both value and percentage in slice of Pie Chart
To display both value and percentage on your pie chart, follow these steps:
1. Go to Visualizer > Chart Library
2. Select the chart you want and click to edit it.
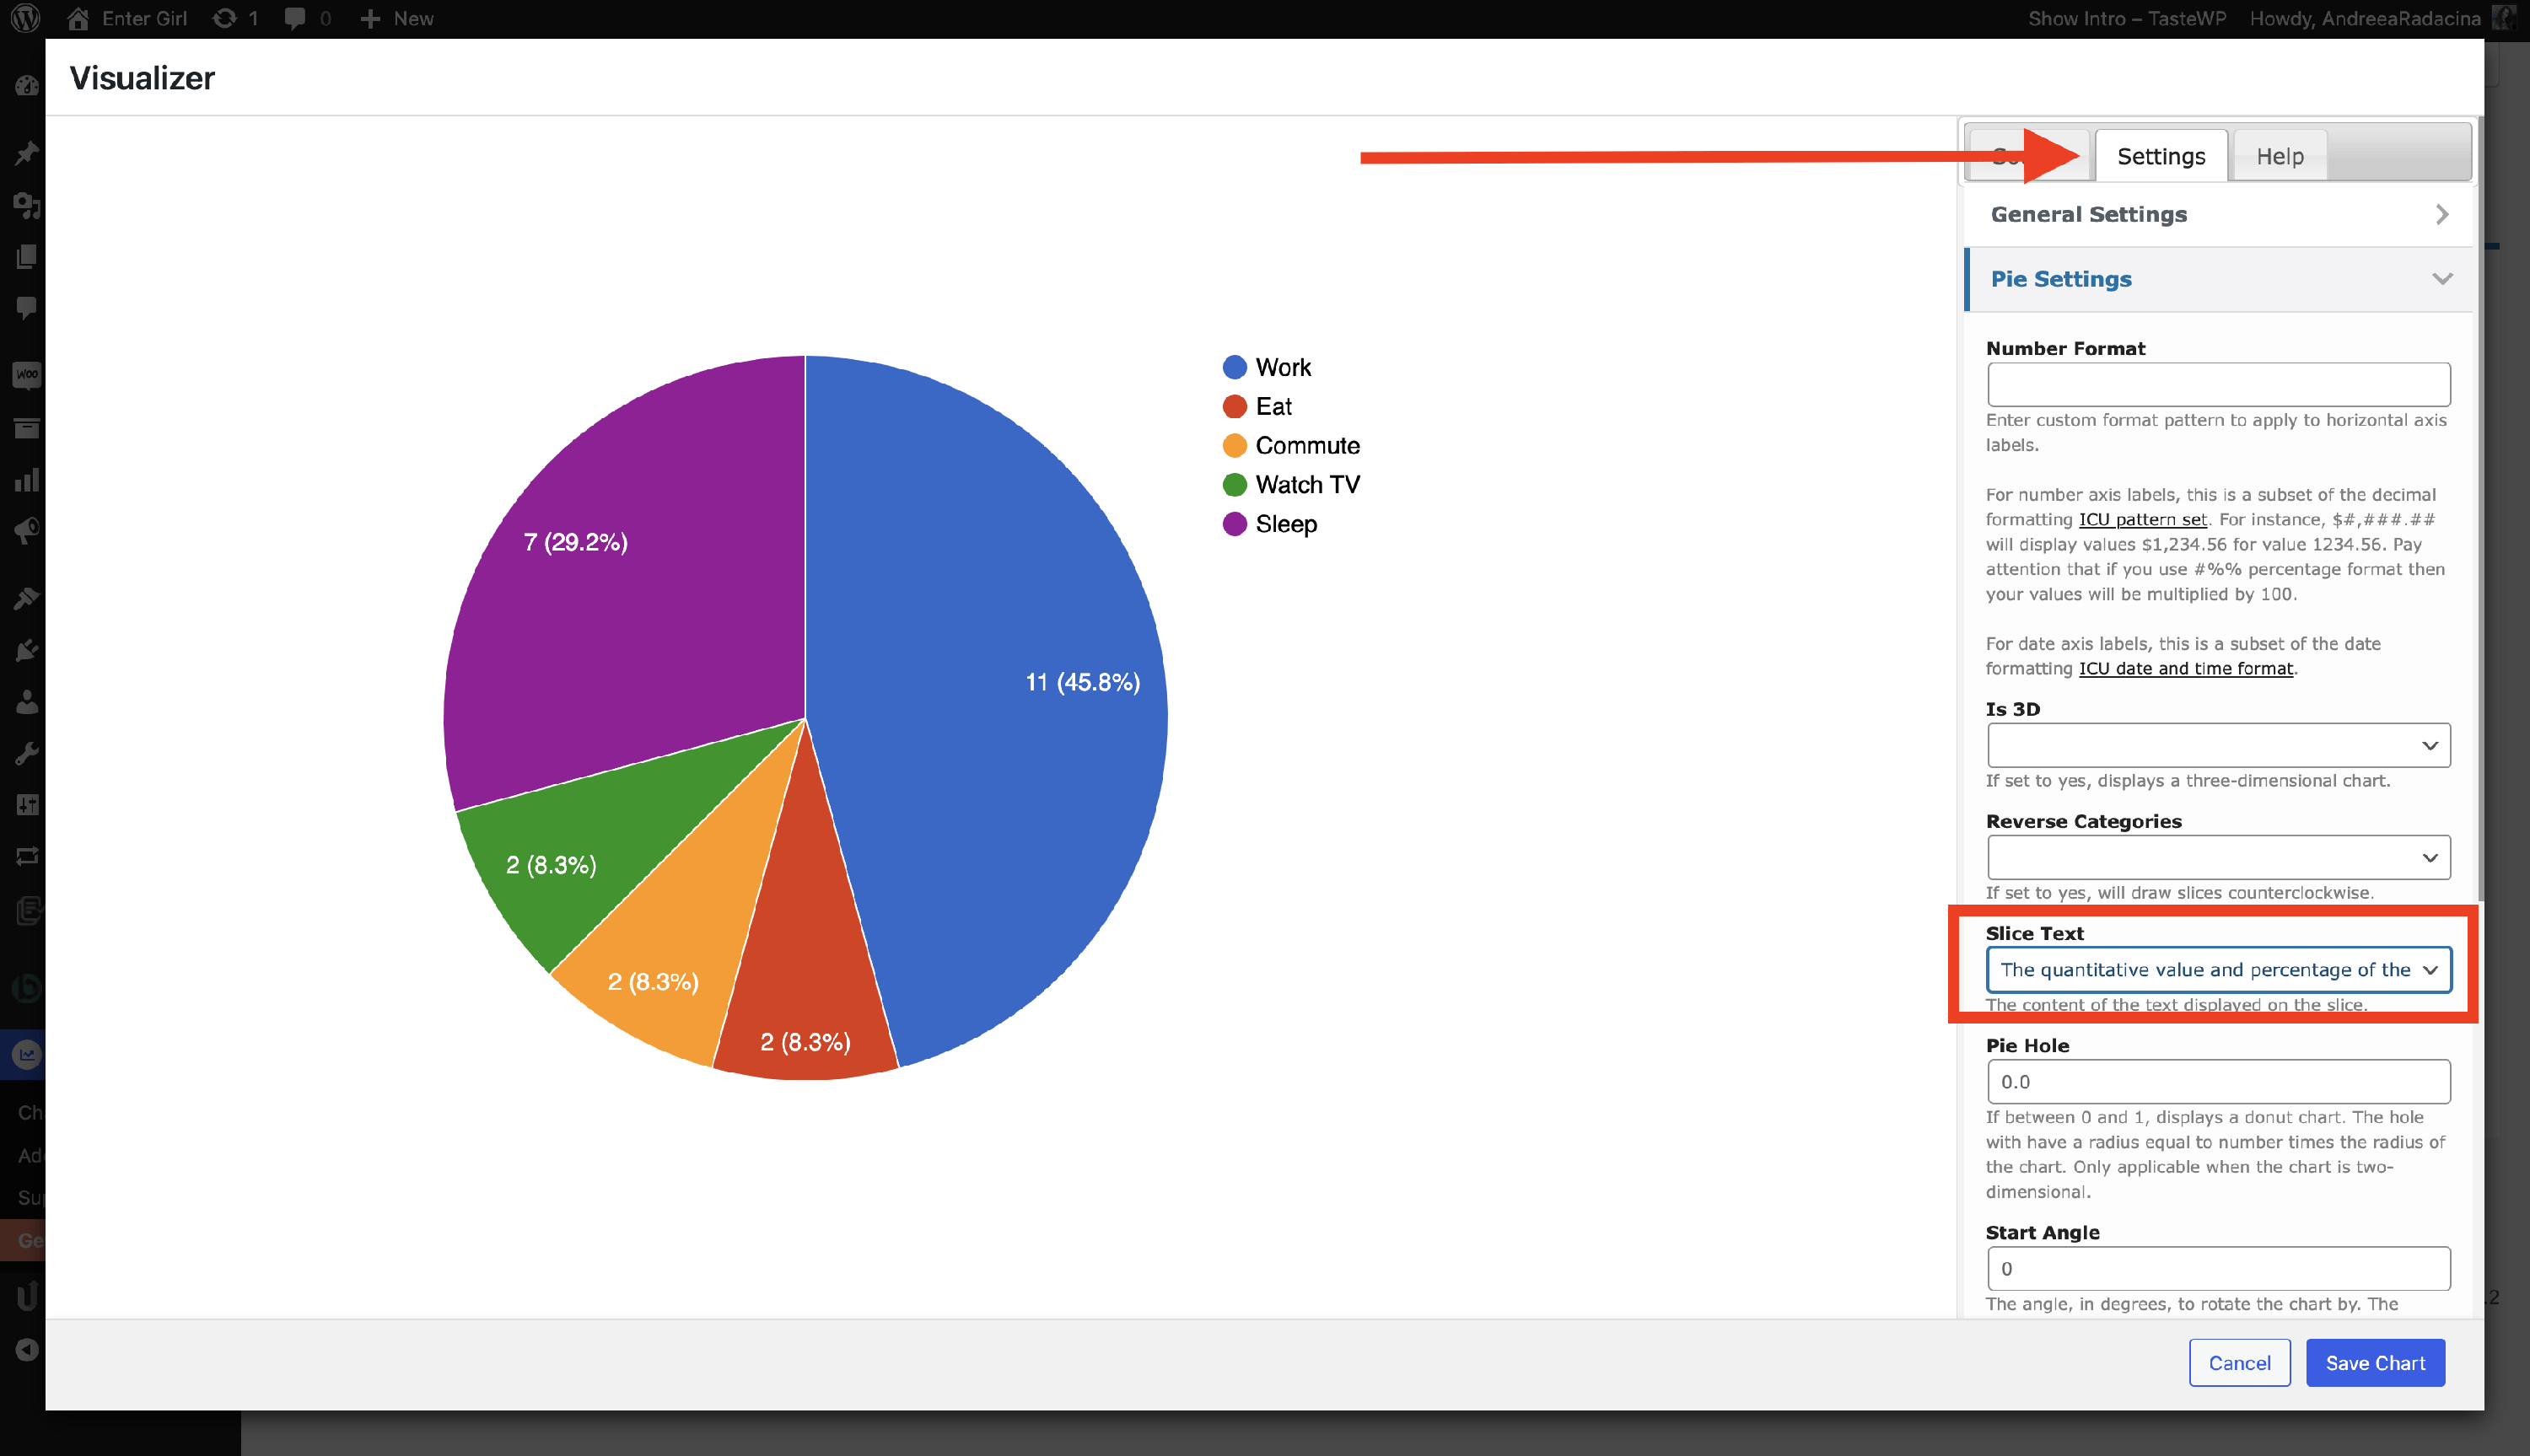
3. Navigate to Settings > Pie Settings, and you'll find the Slice Text option.
4. Select The quantitative value and percentage of the slice option from the dropdown.
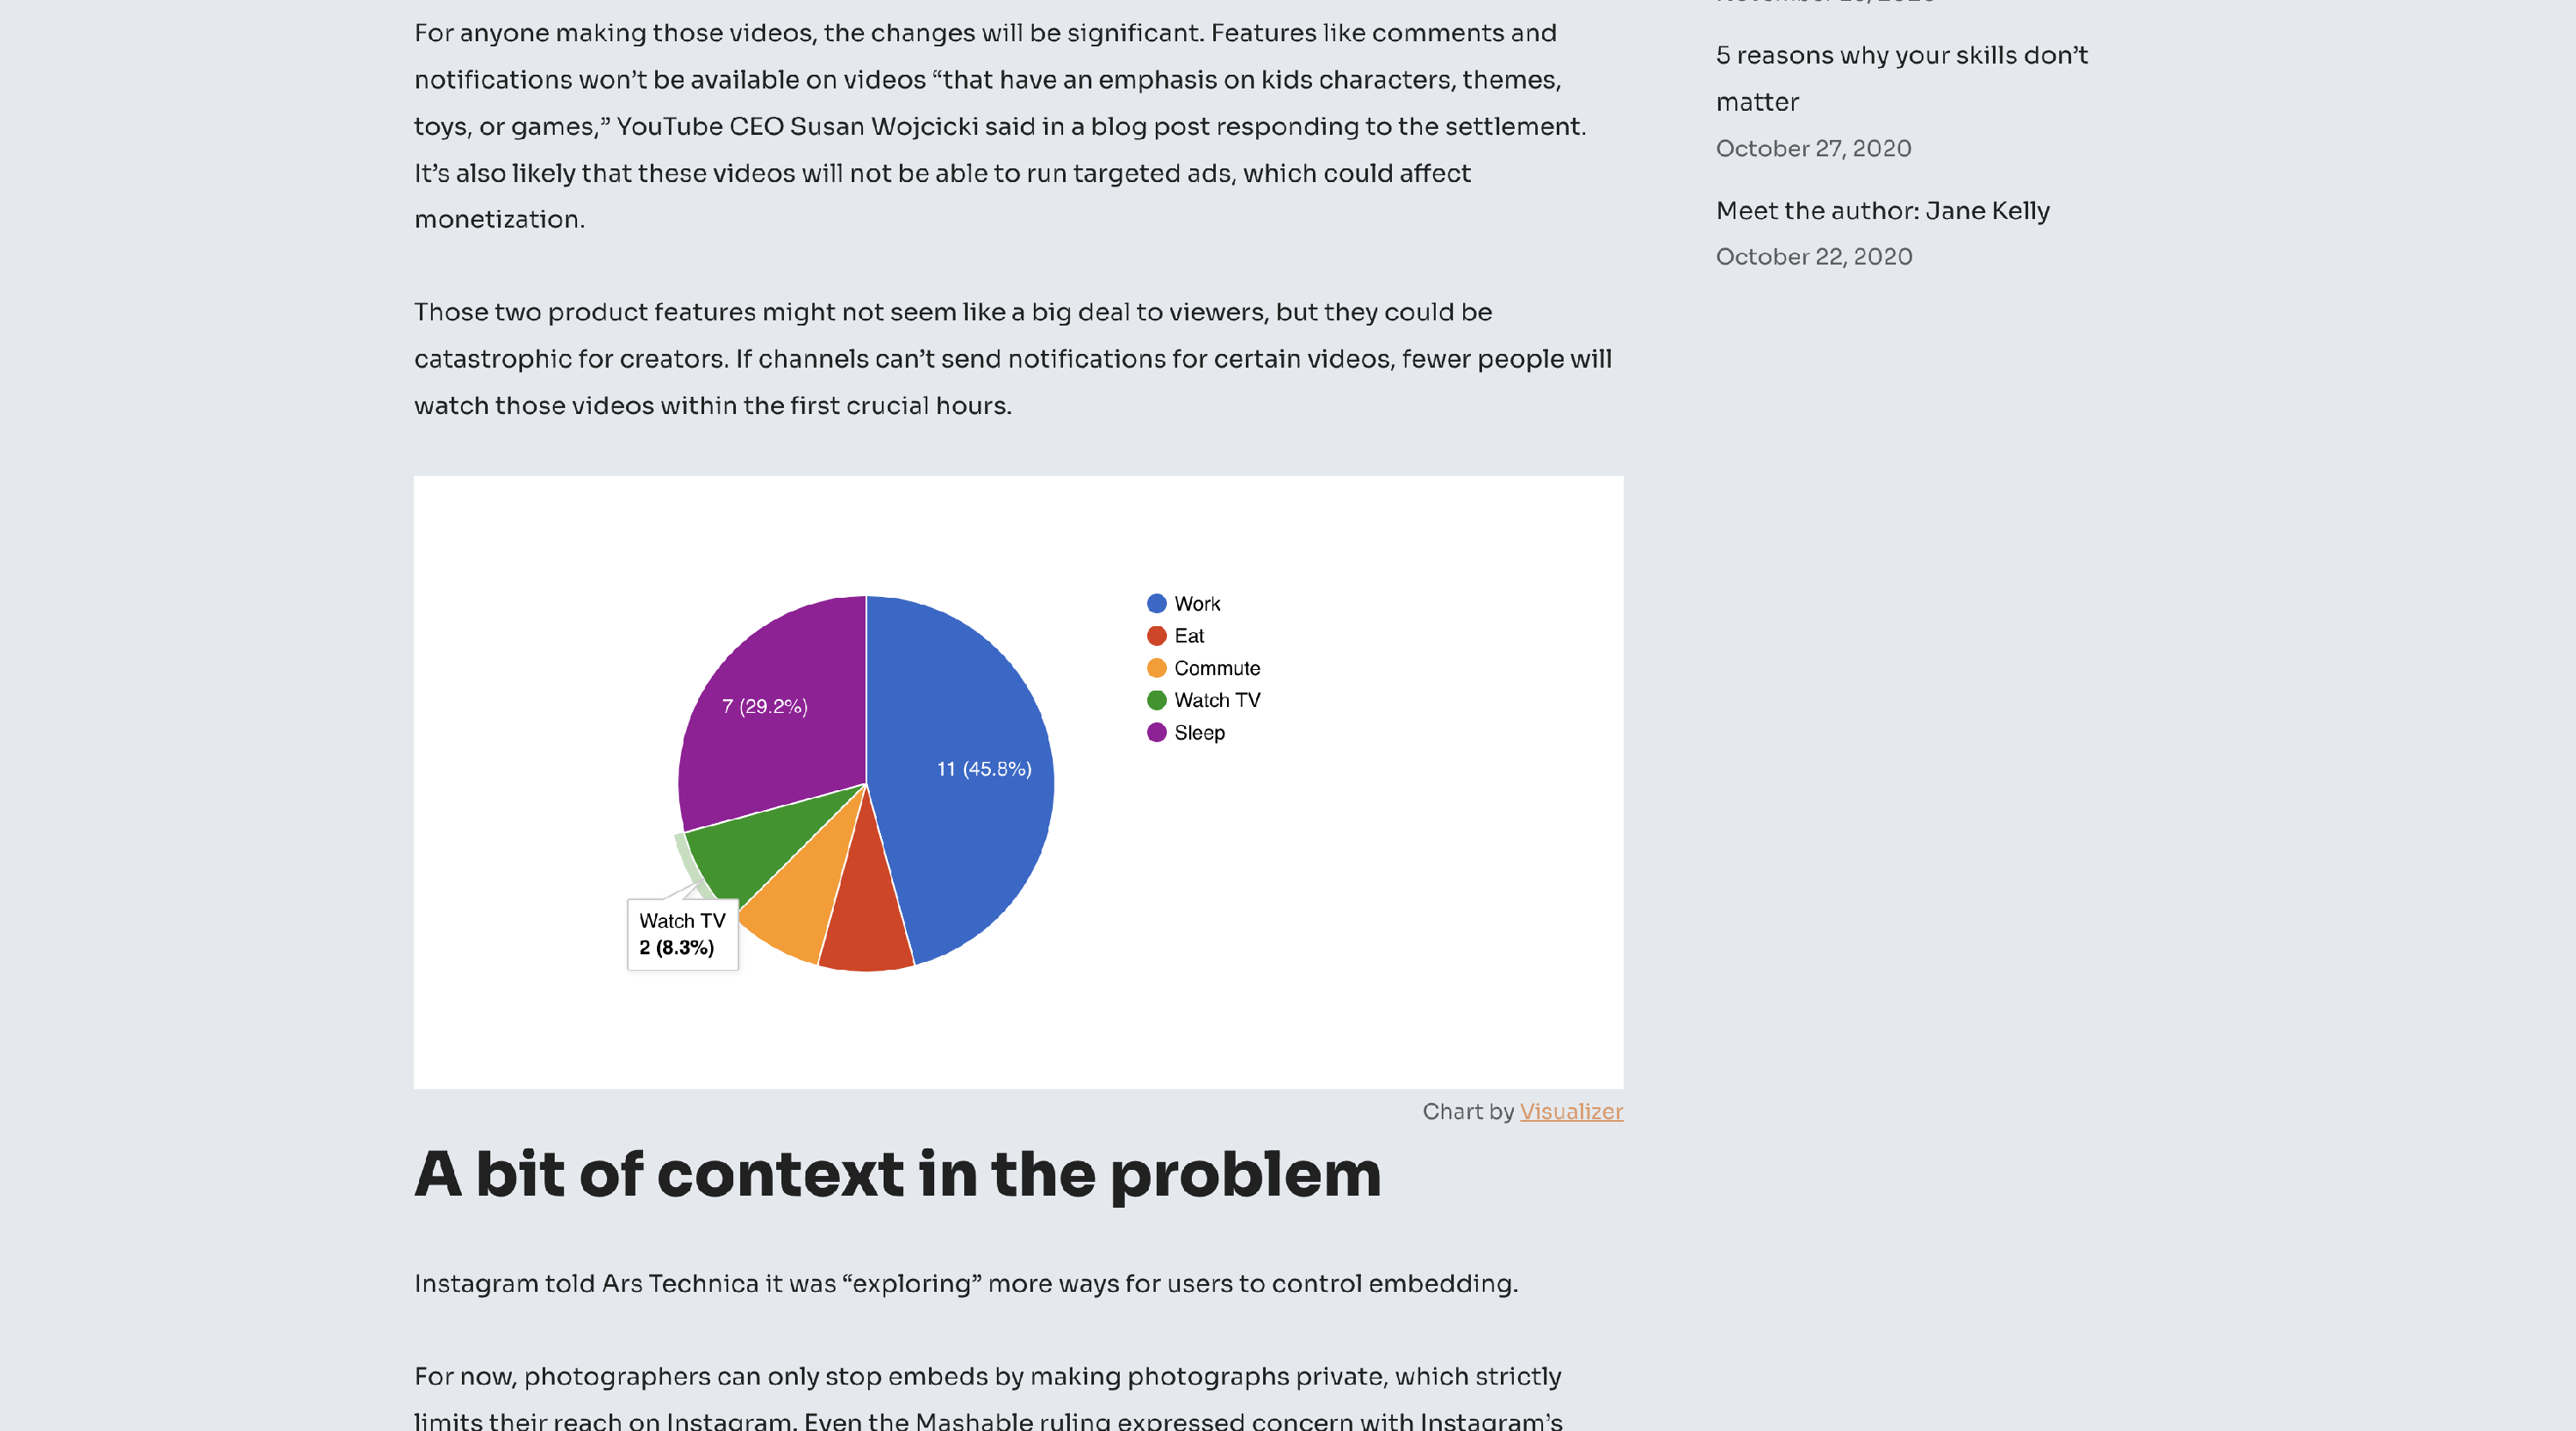
5. Finally, click on the Save Chart option, and you can see both values and percentages in the slice of the pie chart.