How to change width and height of a chart in Visualizer
Visualizer lets you control the exact dimensions of any chart by setting custom width and height values in the chart settings.
1. Navigate to Visualizer > Chart Library.
2. Select the chart to be modified and click to edit it.
3. Switch to the Settings tab.
4. Open the Chart Size & Placement accordion.
5. Expand the Chart Size/Layout accordion.
6. Enter the preferred width and height of the chart in the Width And Height Of Chart option.
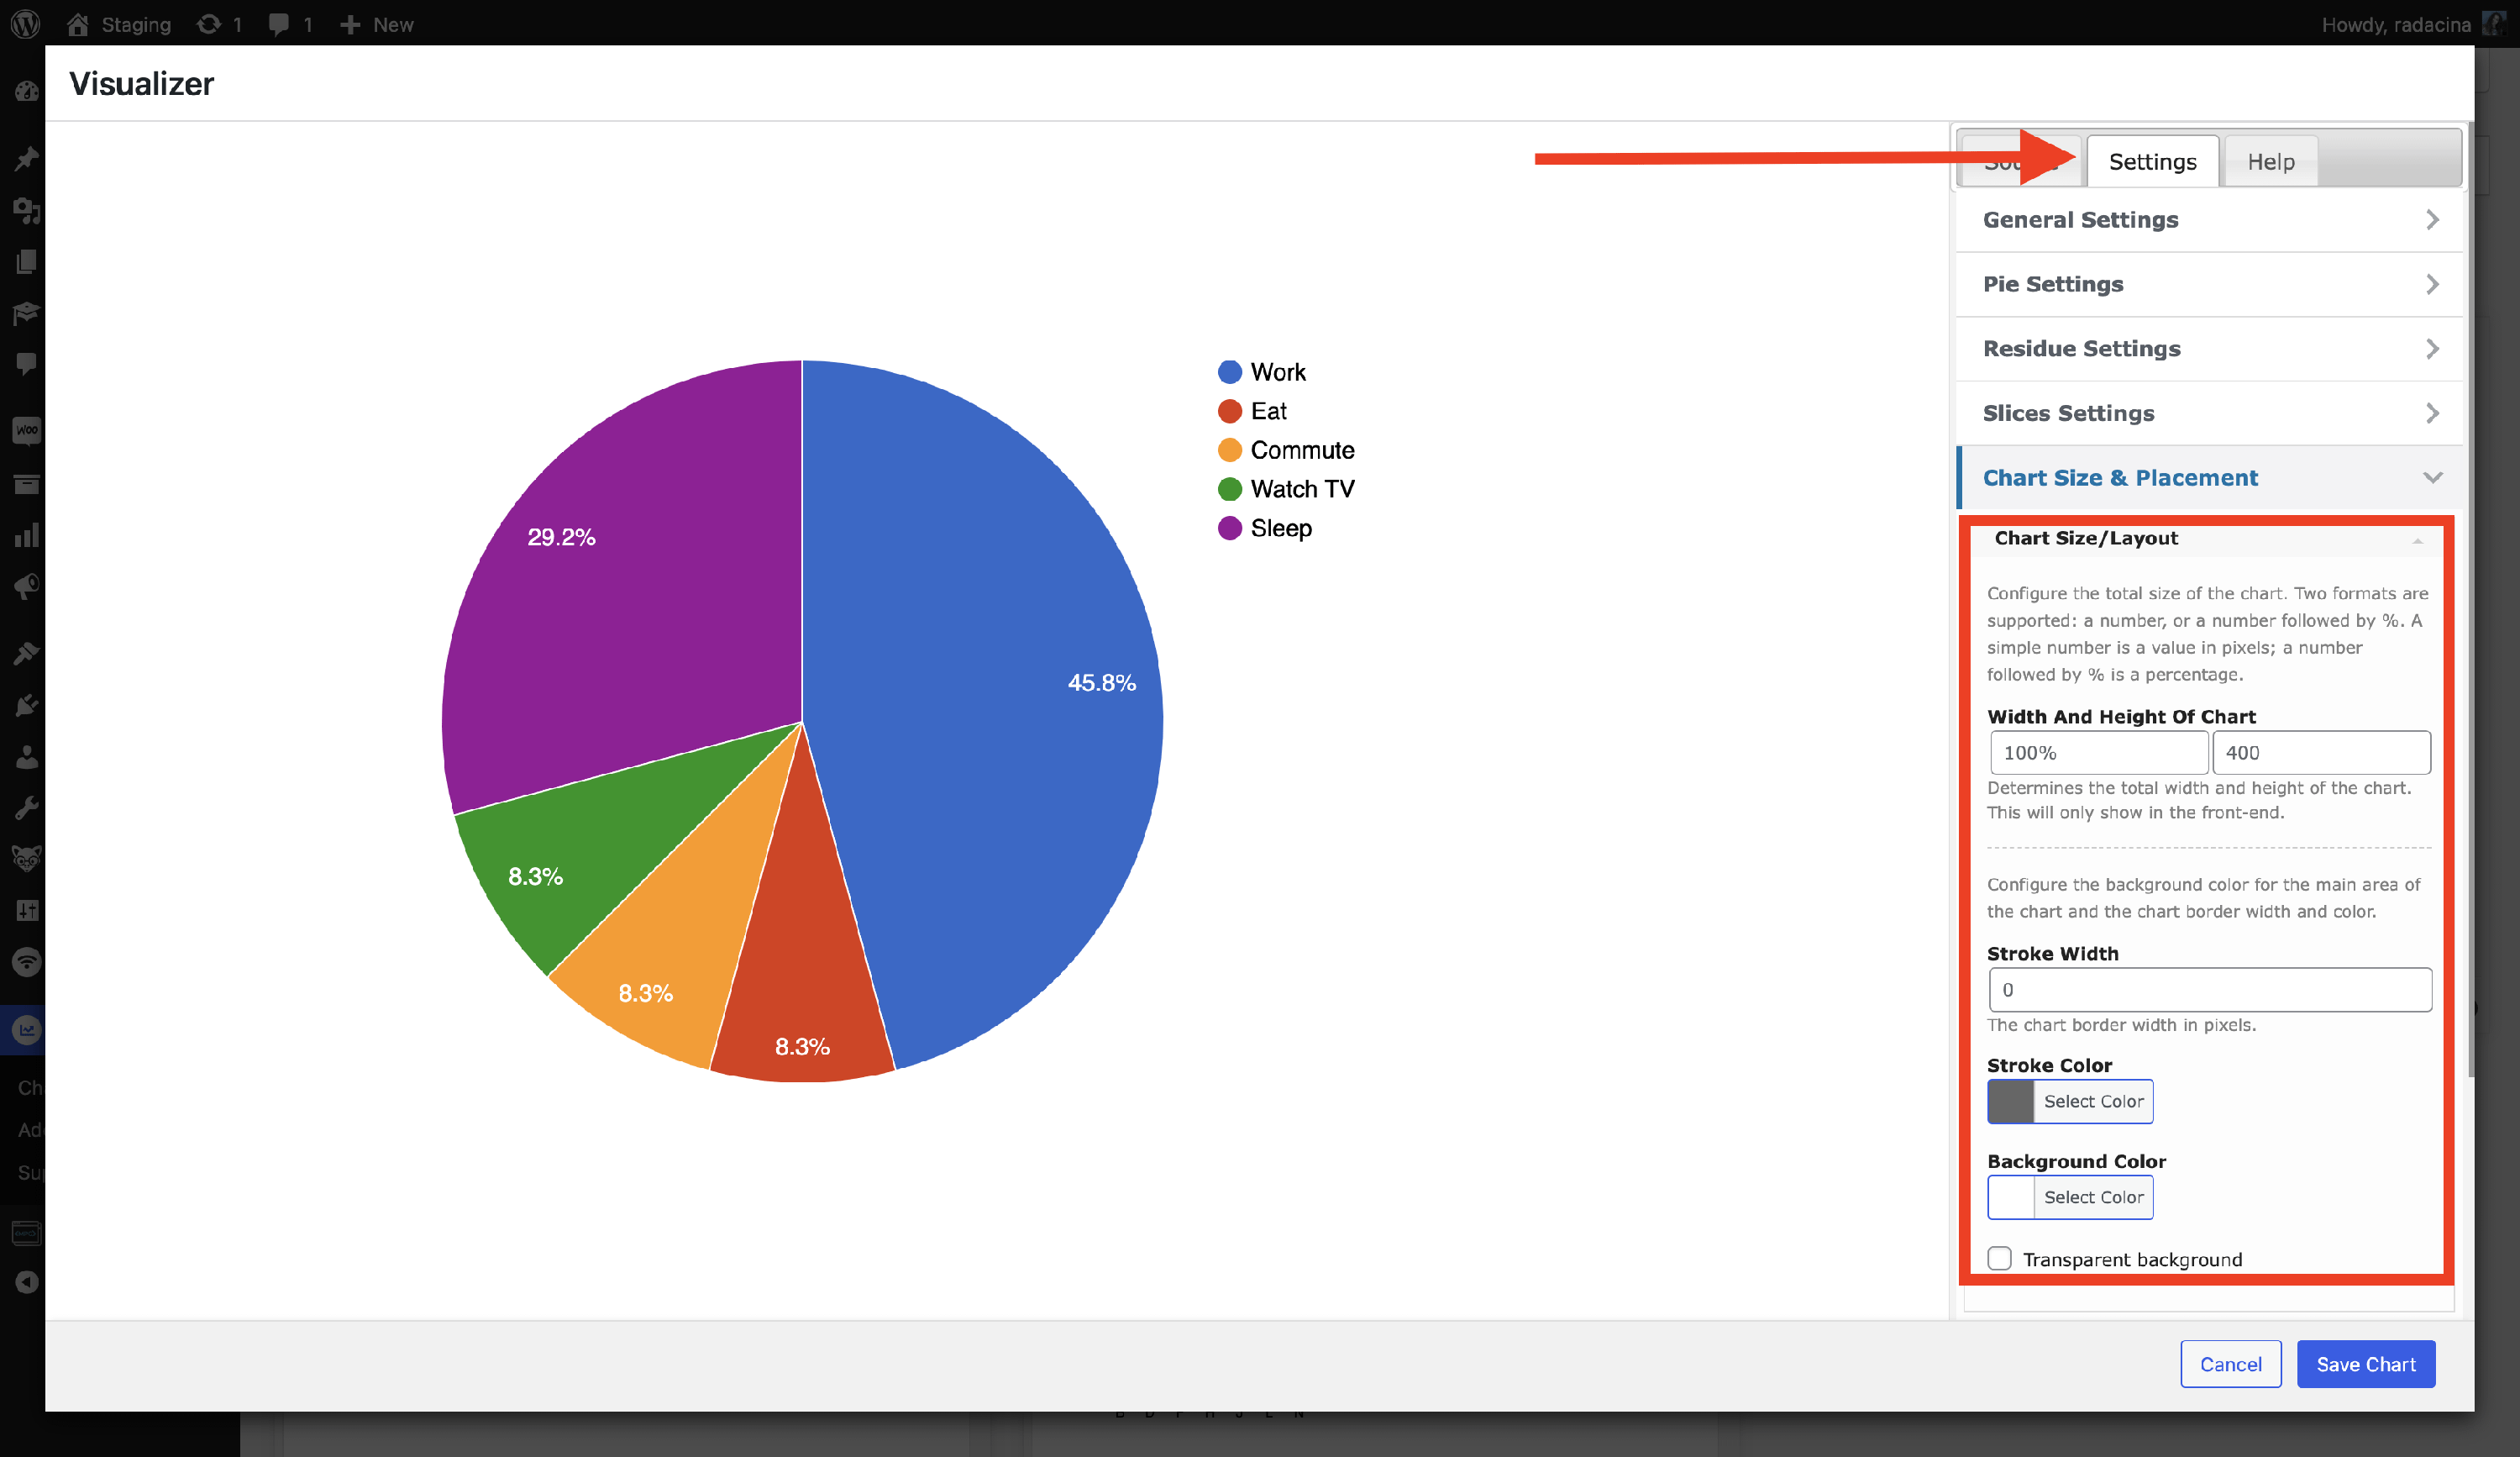
7. Additionally, you can change Stroke's width, Stroke Color, and Background Color in the same tab.
8. Click on the Save Chart button to make changes!