How can I add title to a chart in Visualizer
You can add a title to any Visualizer chart through the chart's Settings panel.
1. After you have created a chart, go to Visualizer > Chart Library
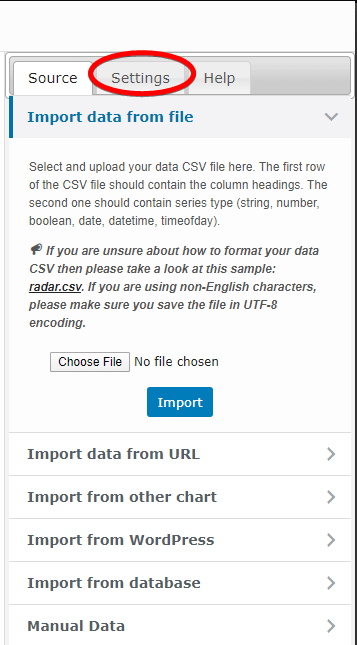
2. Click edit on the chart already created, select your chart, and on the next page, click Settings.
3. Go to General Settings > Title
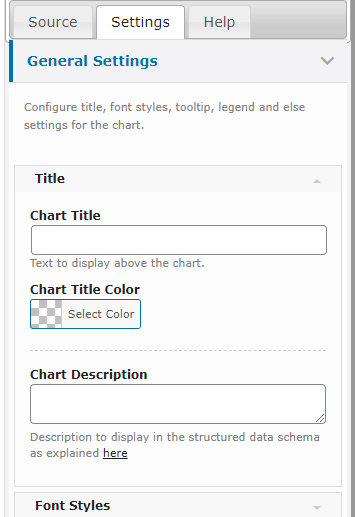
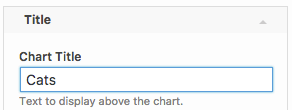
4. Then Enter your desired title in Chart Title input field.
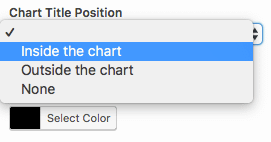
5. Also, you can set where you want to display the title, on Chart Title Position option.
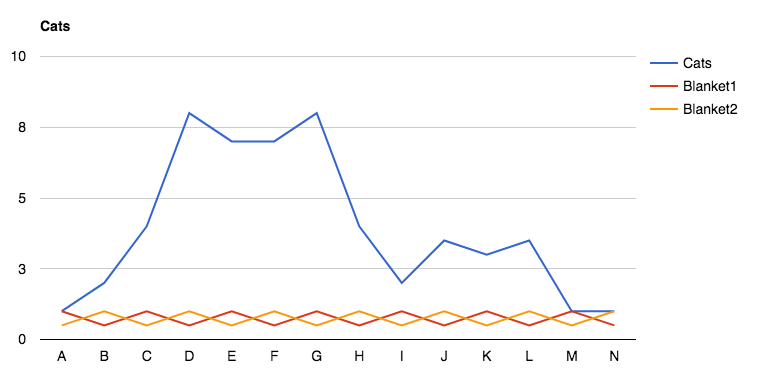
6. Click on Save Chart button, and see the title on your chart!