How to use Lazy Load feature in Visualizer
The lazy load feature works for charts that use the Google Charts library. When enabled, charts only render when they scroll into the visitor's viewport, which can improve page load performance.
⚠️ Important: Lazy Load may cause charts to fail to render on the first page visit in some setups. If your charts require a page refresh before they display correctly, disable Lazy Load as described in the Disabling Lazy Load section below.
To use this feature you need to add the lazy=yes or lazy=<number> parameter to the shortcode.
For example: [visualizer id=XXX lazy="yes"] or [visualizer id=XXX lazy=200].
In this article
Block Editor
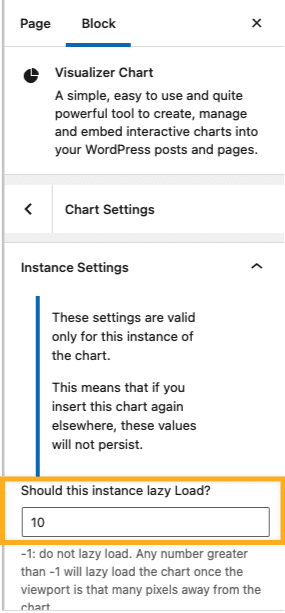
The Visualizer block provides the option for enabling the lazy load option under the Instance Settings, as shown in the below screenshot.
The following filter can also be used to enable this option by default on all the charts. It works for charts inserted as a shortcode and in the block editor.
add_filter( 'visualizer_lazy_by_default', function( $lazy, $chart_id ) {
	// $lazy= 'yes'; for all charts to lazy load with default rootMargin
	// $lazy= 20; for all charts to lazy load with rootMargin of 20
	return $lazy;
}, 10, 2 );
Chart Settings
The chart's performance can also be improved from the Charts Settings area, which appears while editing a chart.
1. Navigate to Visualizer > Charts Library and click to add or edit a chart.
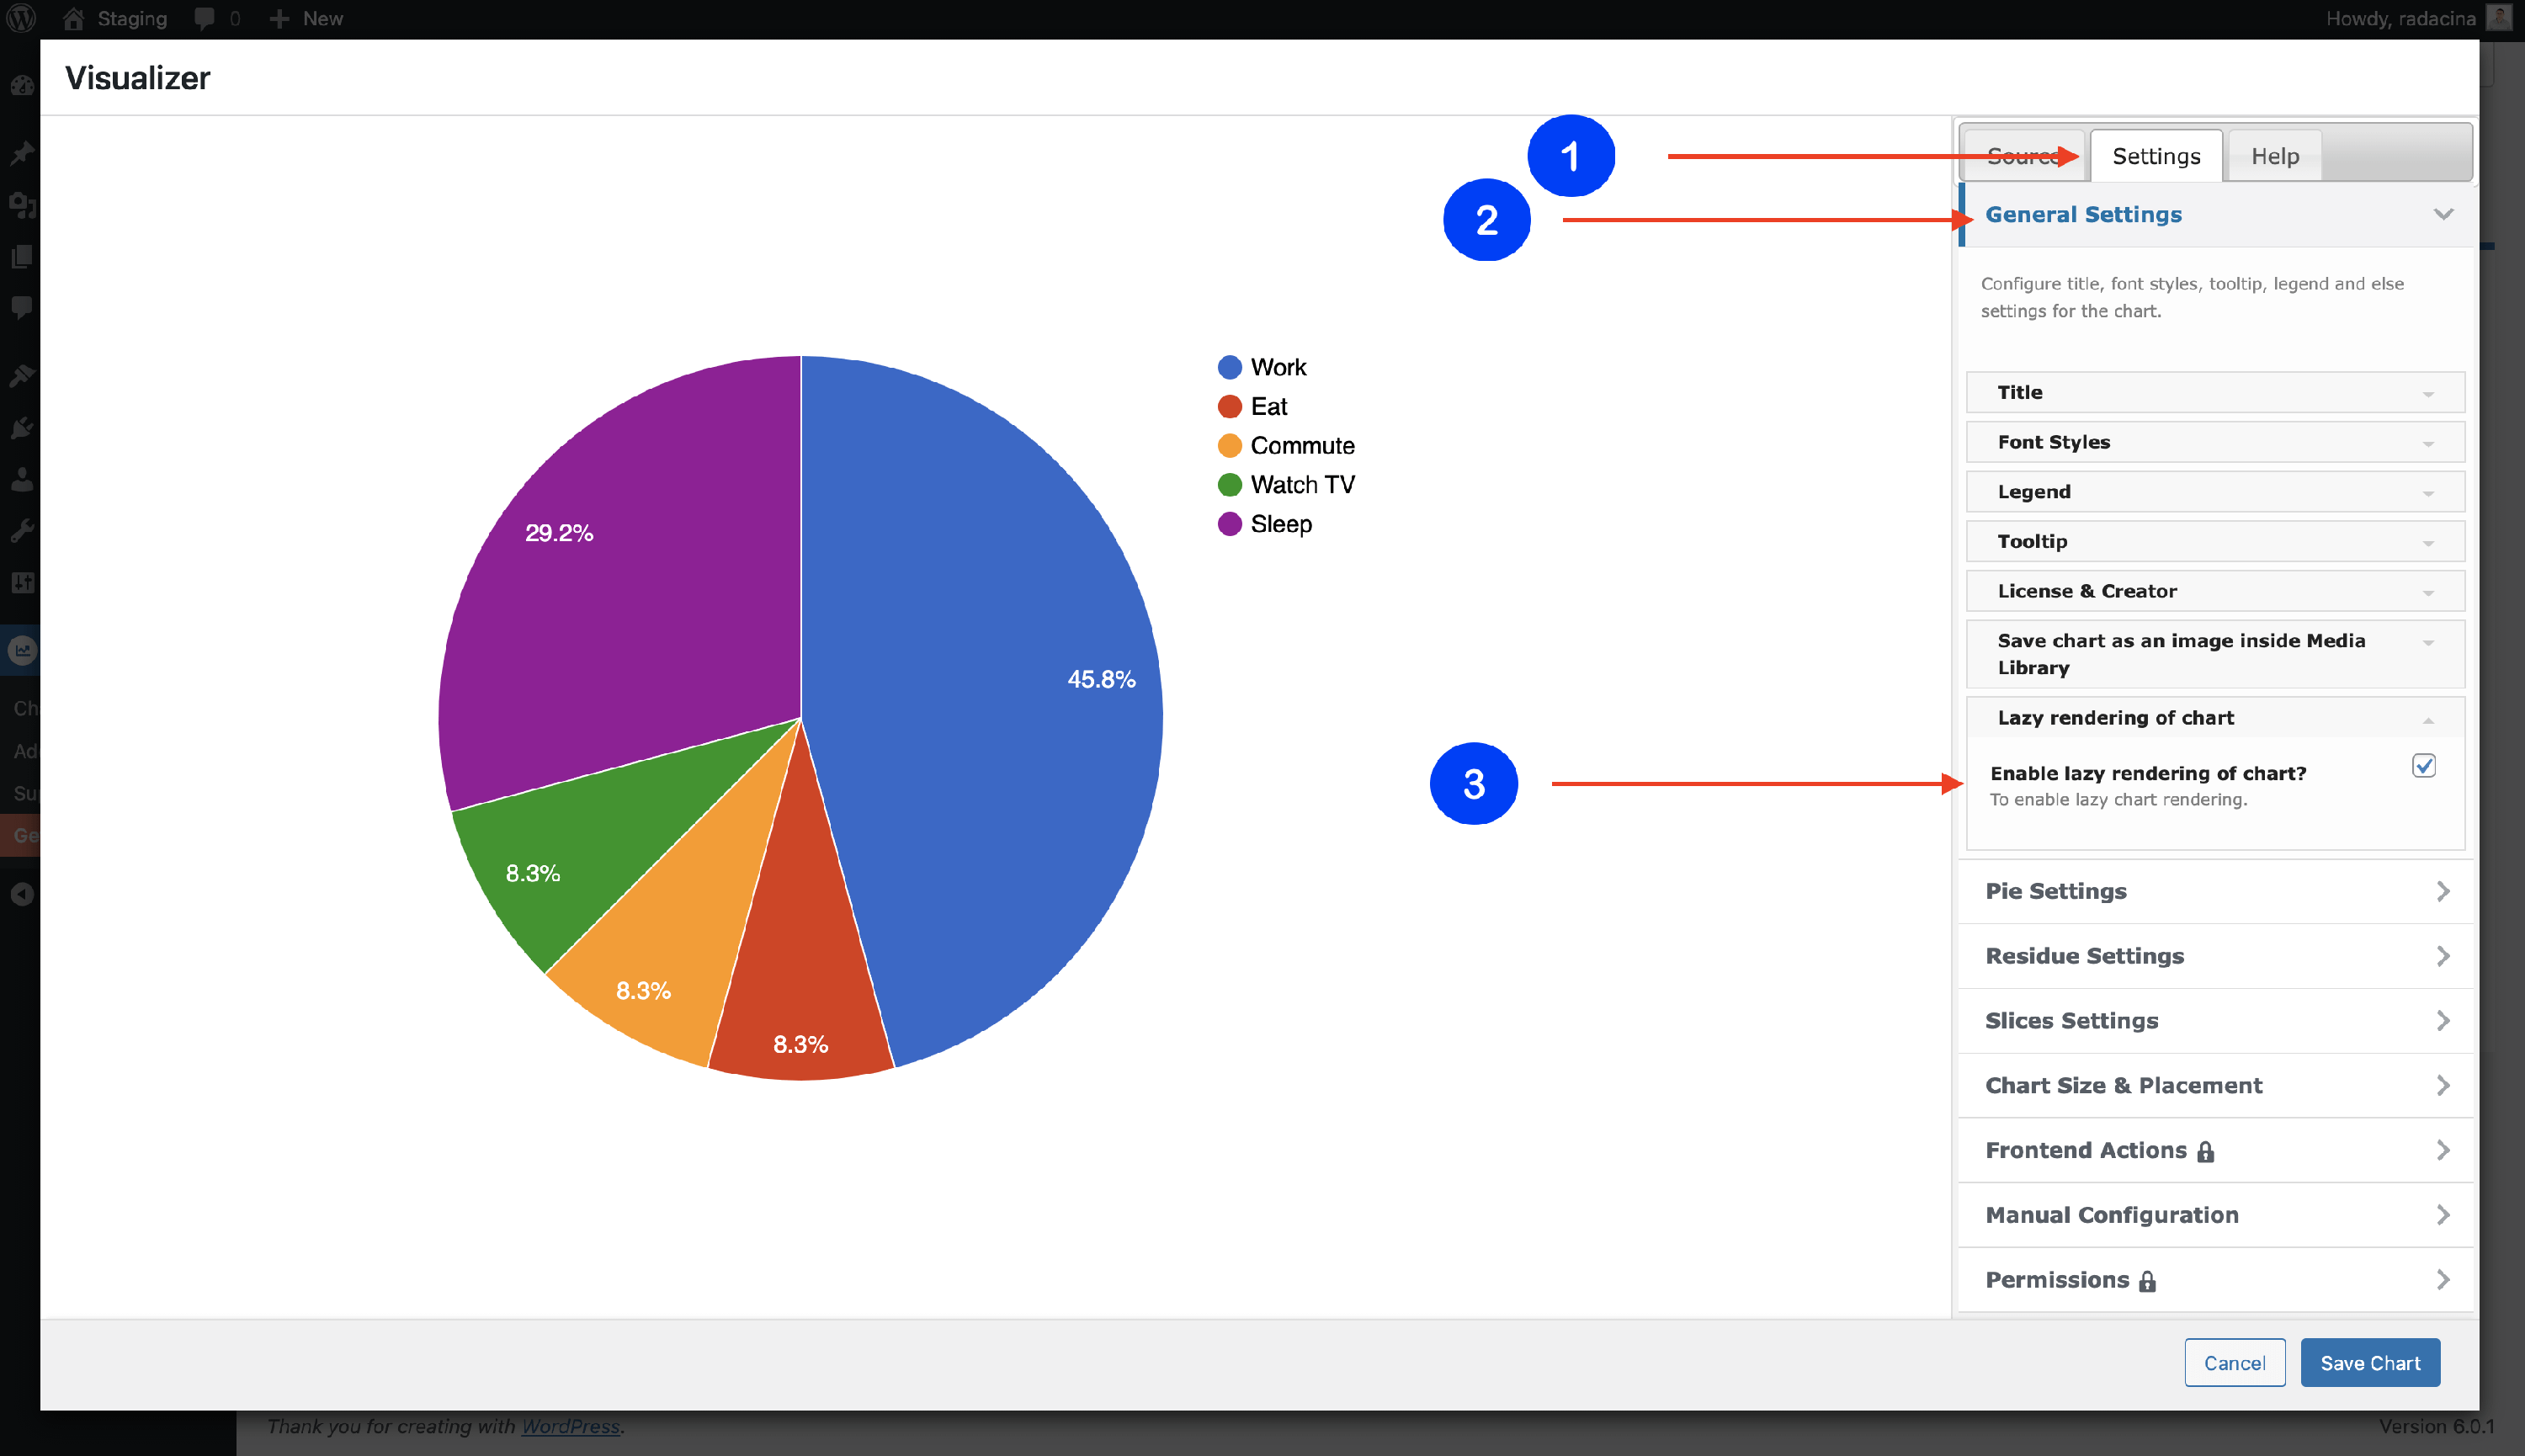
2. Go to the Settings tab and open the General Settings.
3. Open the Lazy rendering of the chart accordion and enable it.
Disabling Lazy Load
If Lazy Load is causing charts to not display correctly, you can disable it for an individual chart from the same Chart Settings area.
1. Navigate to Visualizer > Charts Library and click to edit the affected chart.
2. Go to the Settings tab and open the General Settings.
3. Open the Lazy rendering of the chart accordion and disable it.
4. Save the chart.
After saving, the chart will load immediately when the page opens instead of waiting for the element to enter the viewport.
Troubleshooting Lazy Load Issues
Charts not loading on the first page visit
If a chart fails to render on the first visit but appears correctly after a page refresh, Lazy Load is the most likely cause.
This can happen in certain setups — for example, when caching plugins, JavaScript optimizers, or specific themes affect how the page renders on initial load.
To resolve this, follow the steps in the Disabling Lazy Load section above, then:
- Clear your site's cache if you are using a caching plugin.
- Visit the page in a new browser tab to confirm the chart loads without a refresh.
💡 Tip: If you have multiple charts affected by this issue, check whether you are using the visualizer_lazy_by_default filter to enable Lazy Load globally. Removing or adjusting that filter will disable Lazy Load for all shortcode and block-based charts at once.
Lazy Load not working at all
Lazy Load only works with charts that use the Google Charts library. If your chart uses a different rendering library, the lazy load parameter will have no effect. Check the chart type settings to confirm which library is in use.