How to configure chart area in Visualizer
The chart area settings in Visualizer let you define margins and dimensions that control how your chart is positioned within its container.
1. Navigate to Visualizer > Chart Library.
2. Select the chart to be modified and click to edit it.
3. Switch to the Settings tab.
4. Open the Chart Size & Placement accordion.
5. Expand the Placement accordion.
6. Insert the percentages for the Left And Top Margins (how far the chart should be from the left and right edges of the area).
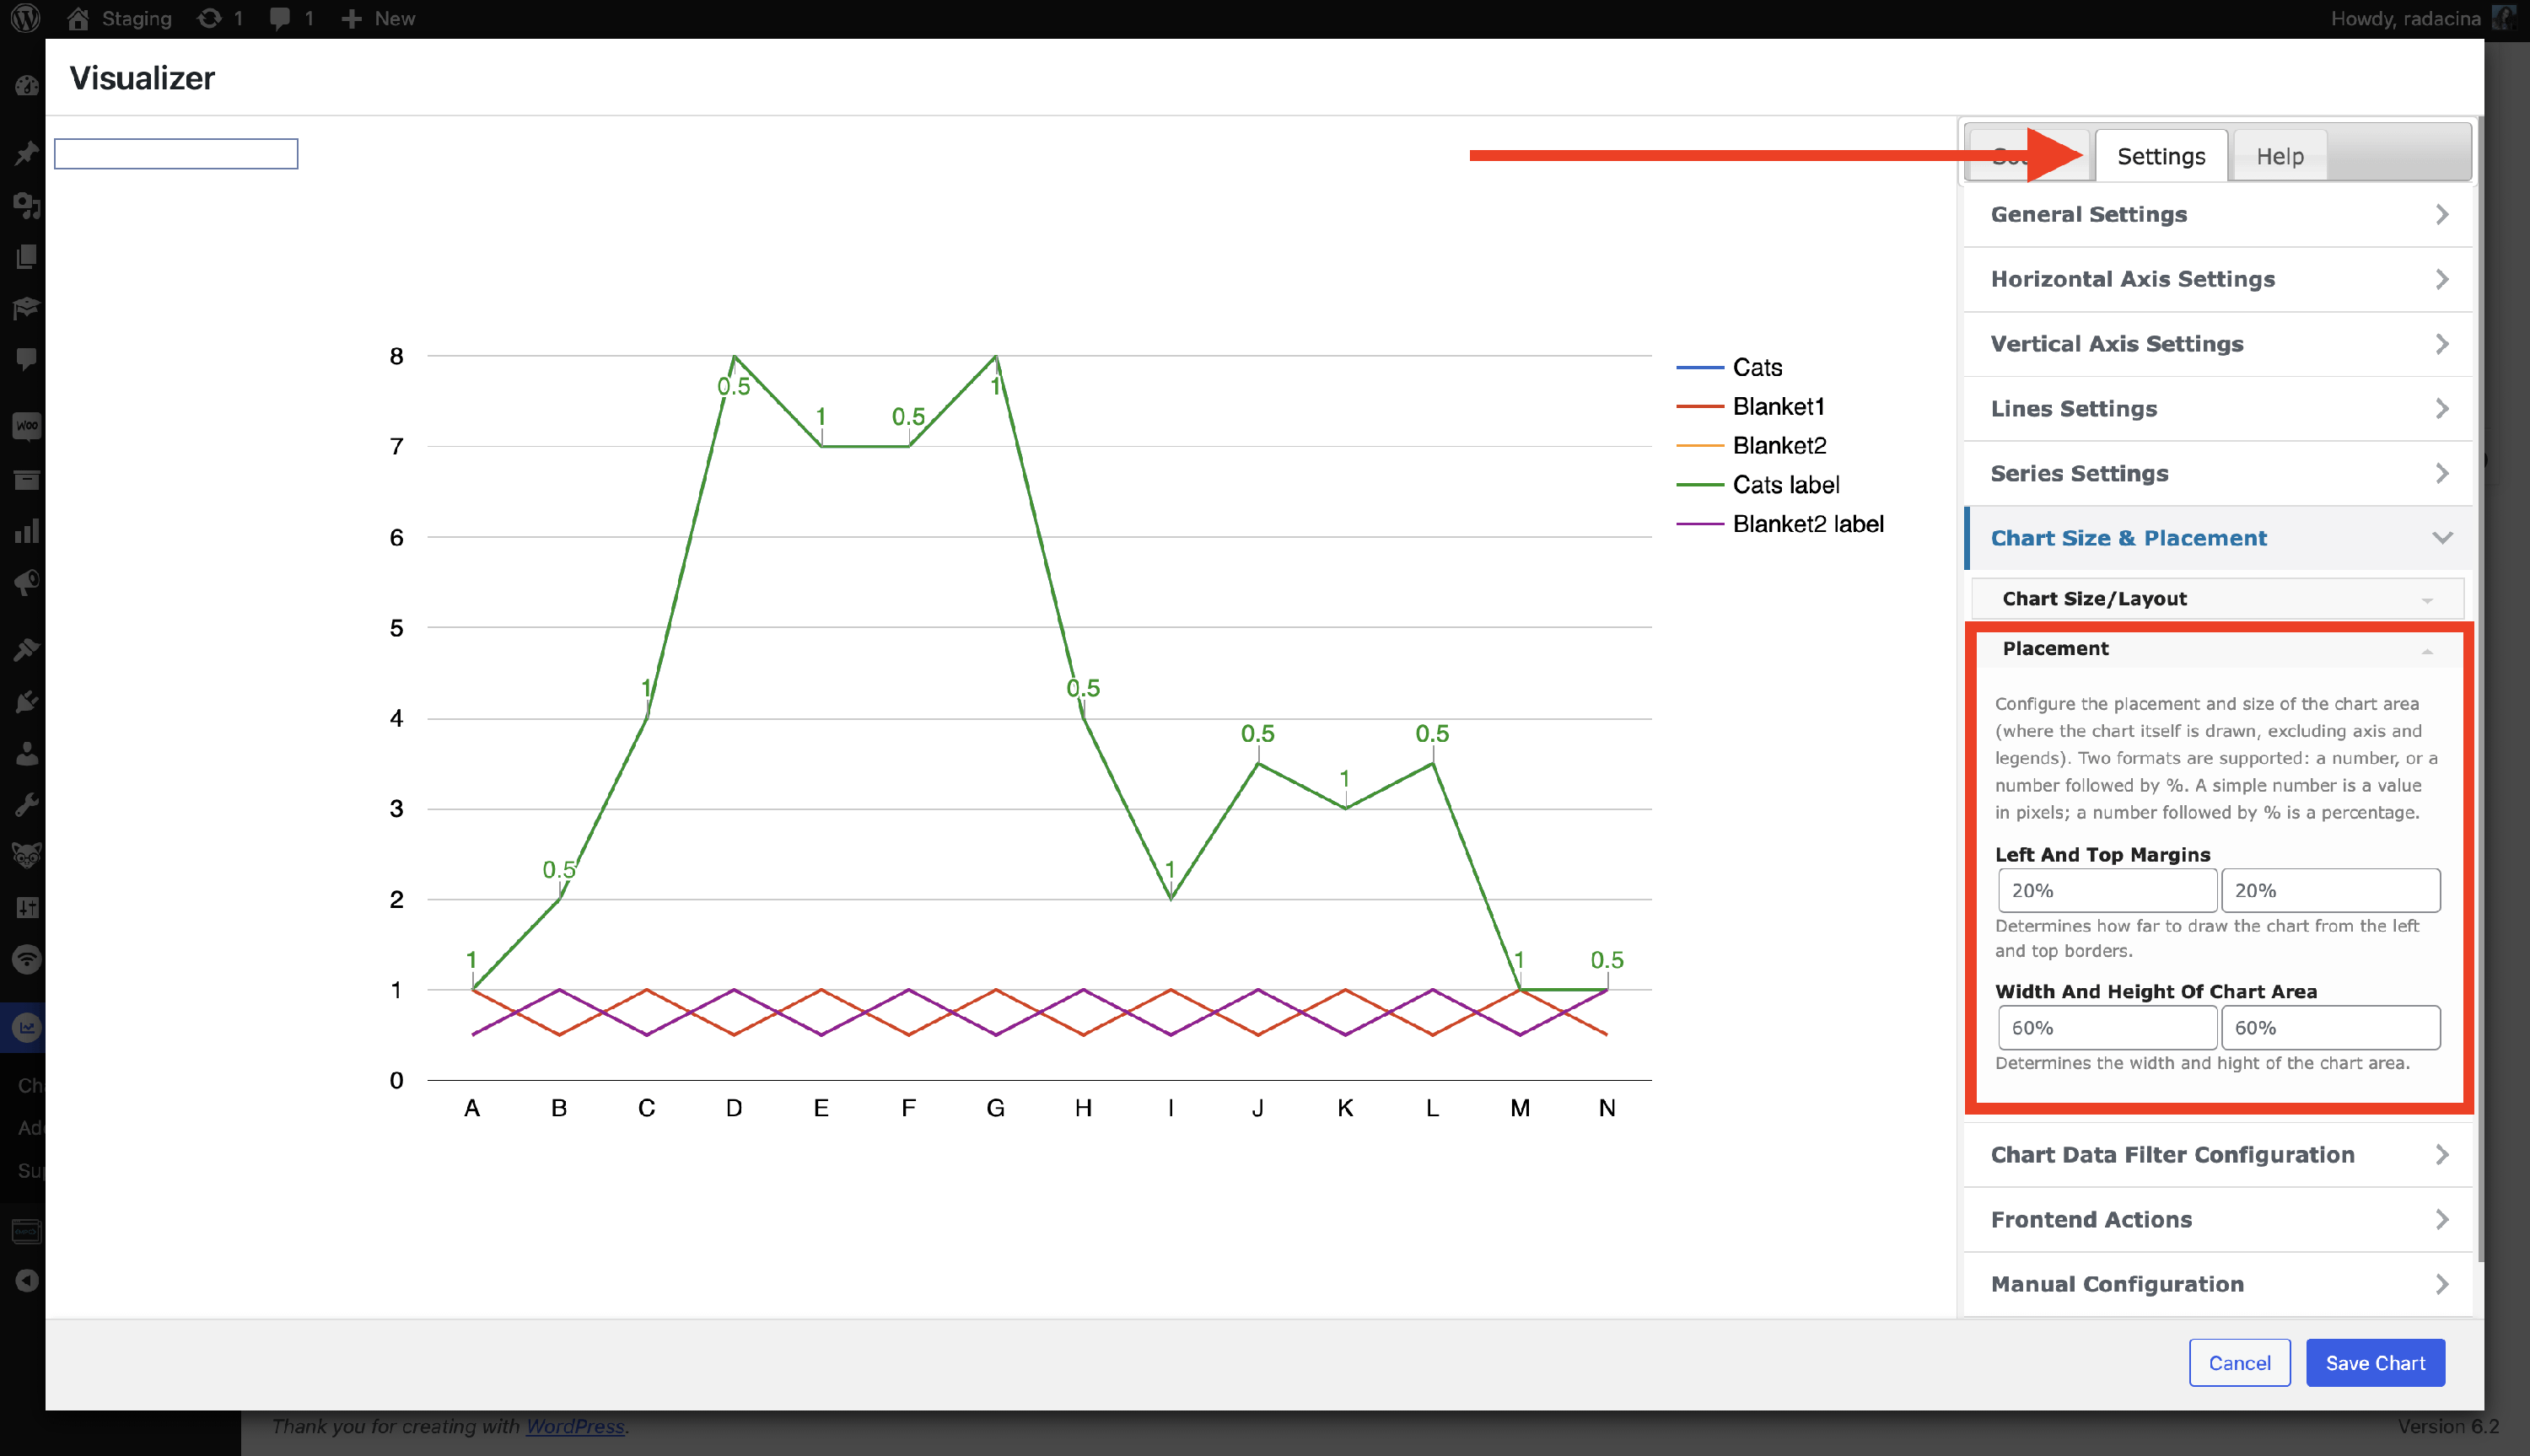
7. The Width and Height of Chart Area option define the width and height of the chart area.
8. Click on the Save Chart button to make changes!