How to Use the AI Chart Builder in Visualizer
The AI Chart Builder is a way to create custom charts using plain-language prompts. Powered by D3.js, it lets you describe the chart you want and generates it automatically — no coding required.
In this article
Getting Started
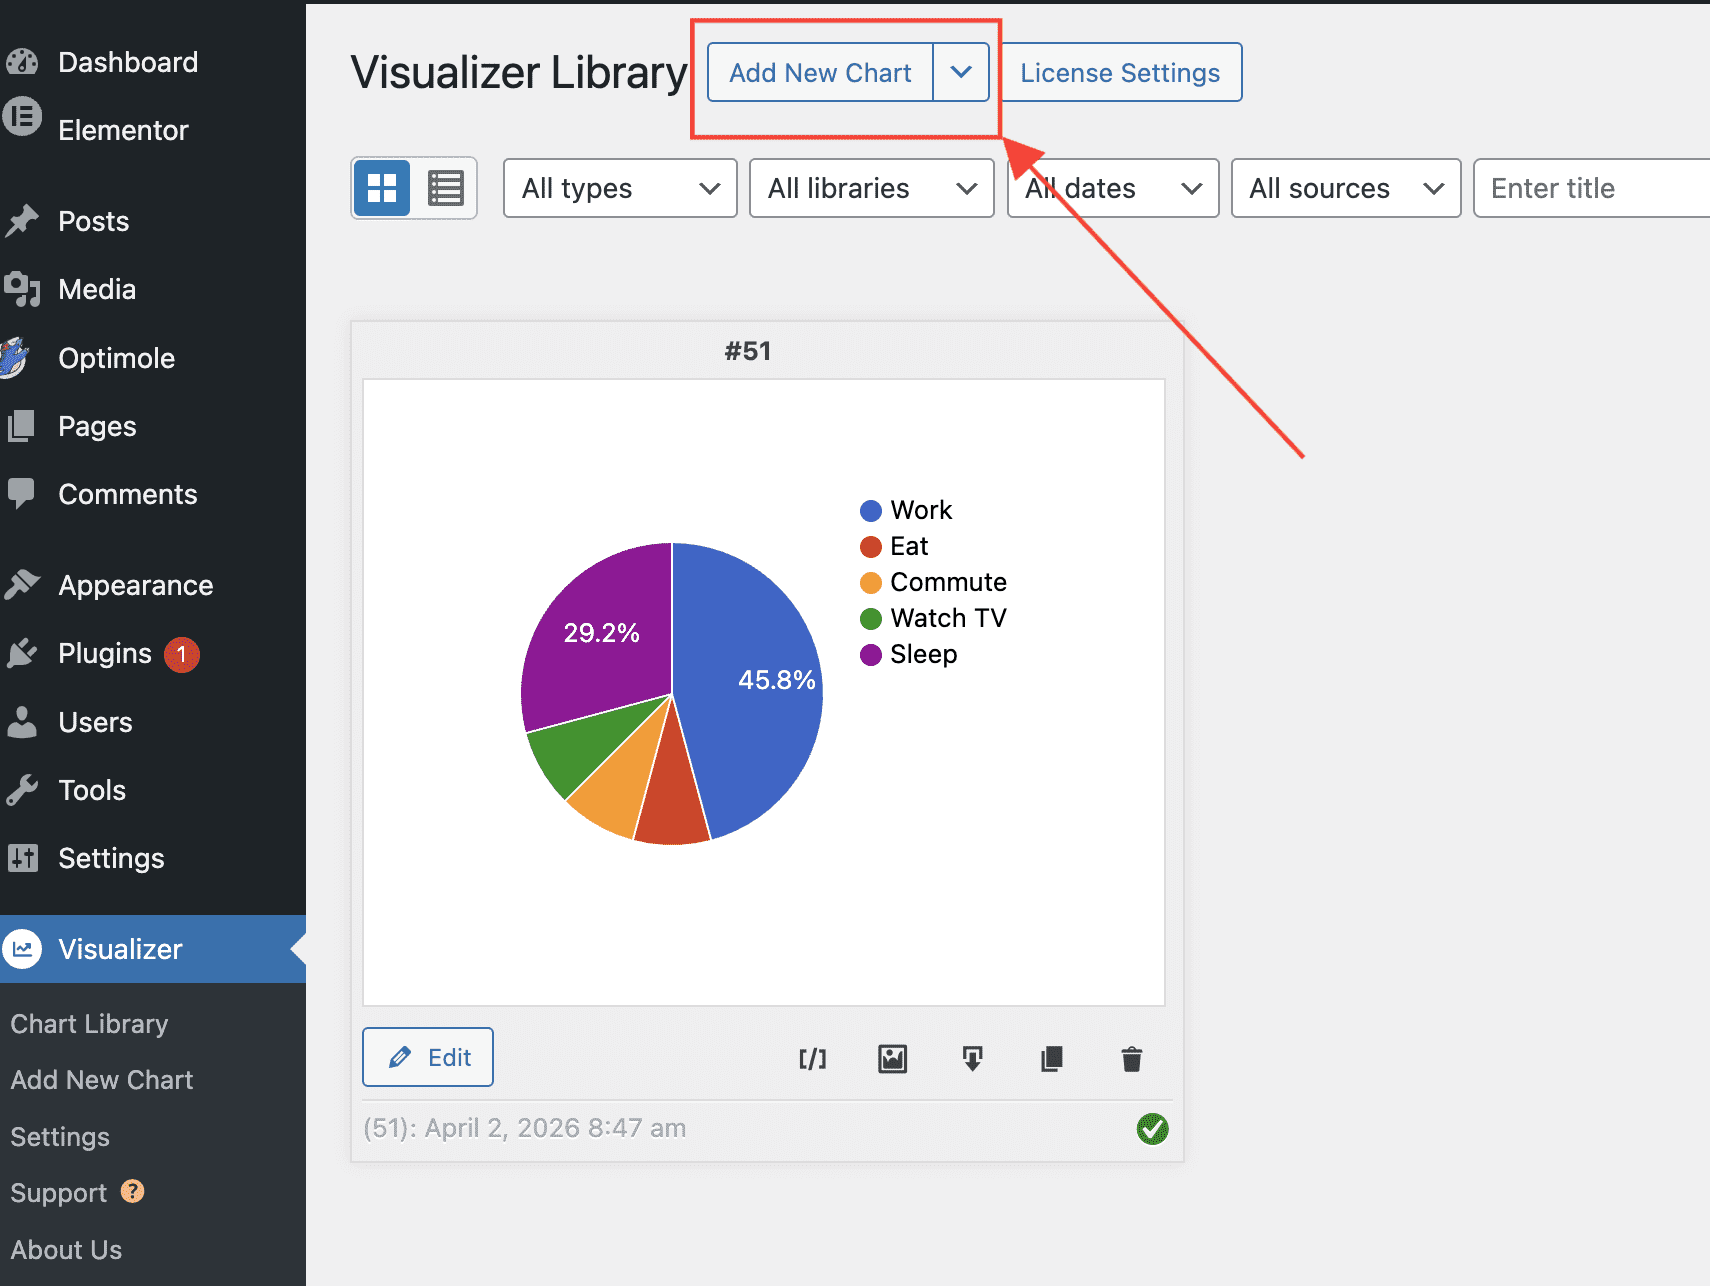
1. Navigate to Visualizer > Chart Library from your WordPress dashboard.
2. Click Add New Chart.
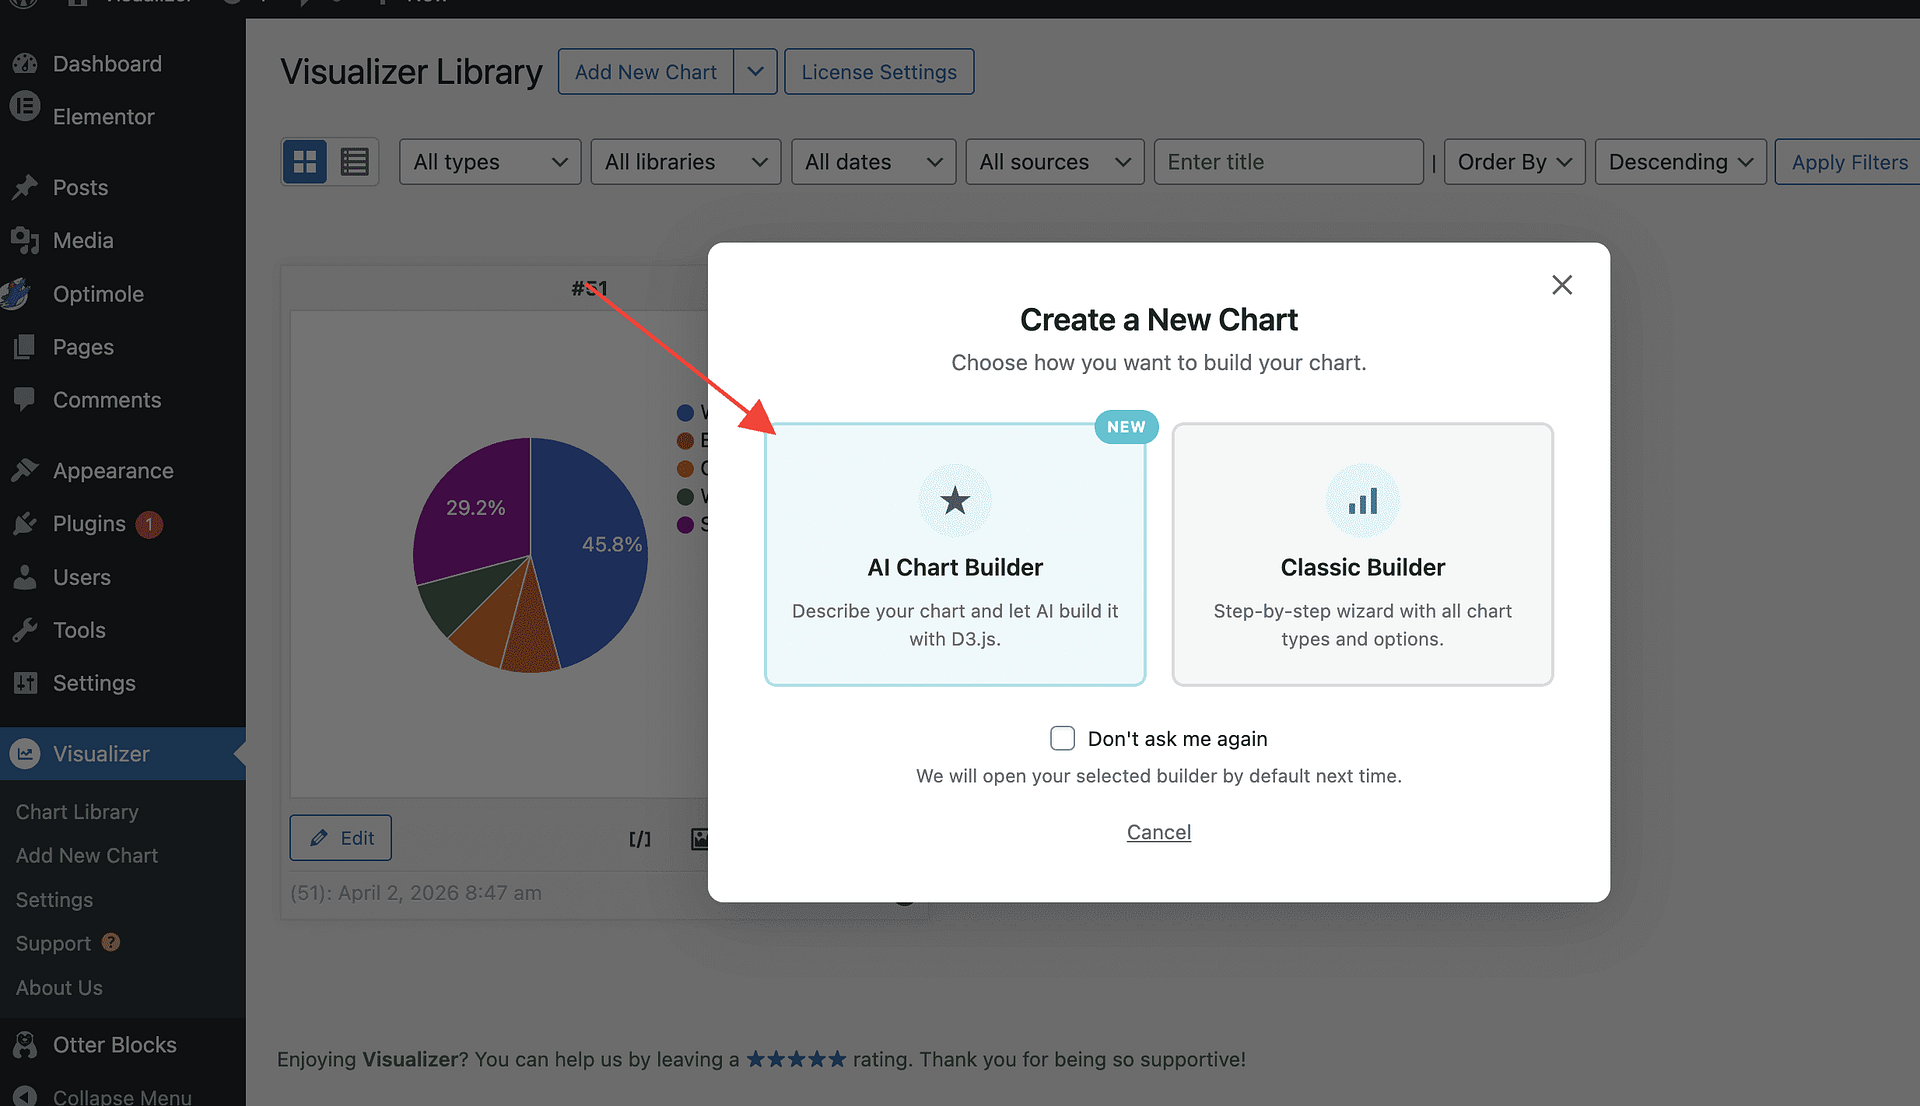
3. In the chart type selection screen, select the AI Chart Builder tab.
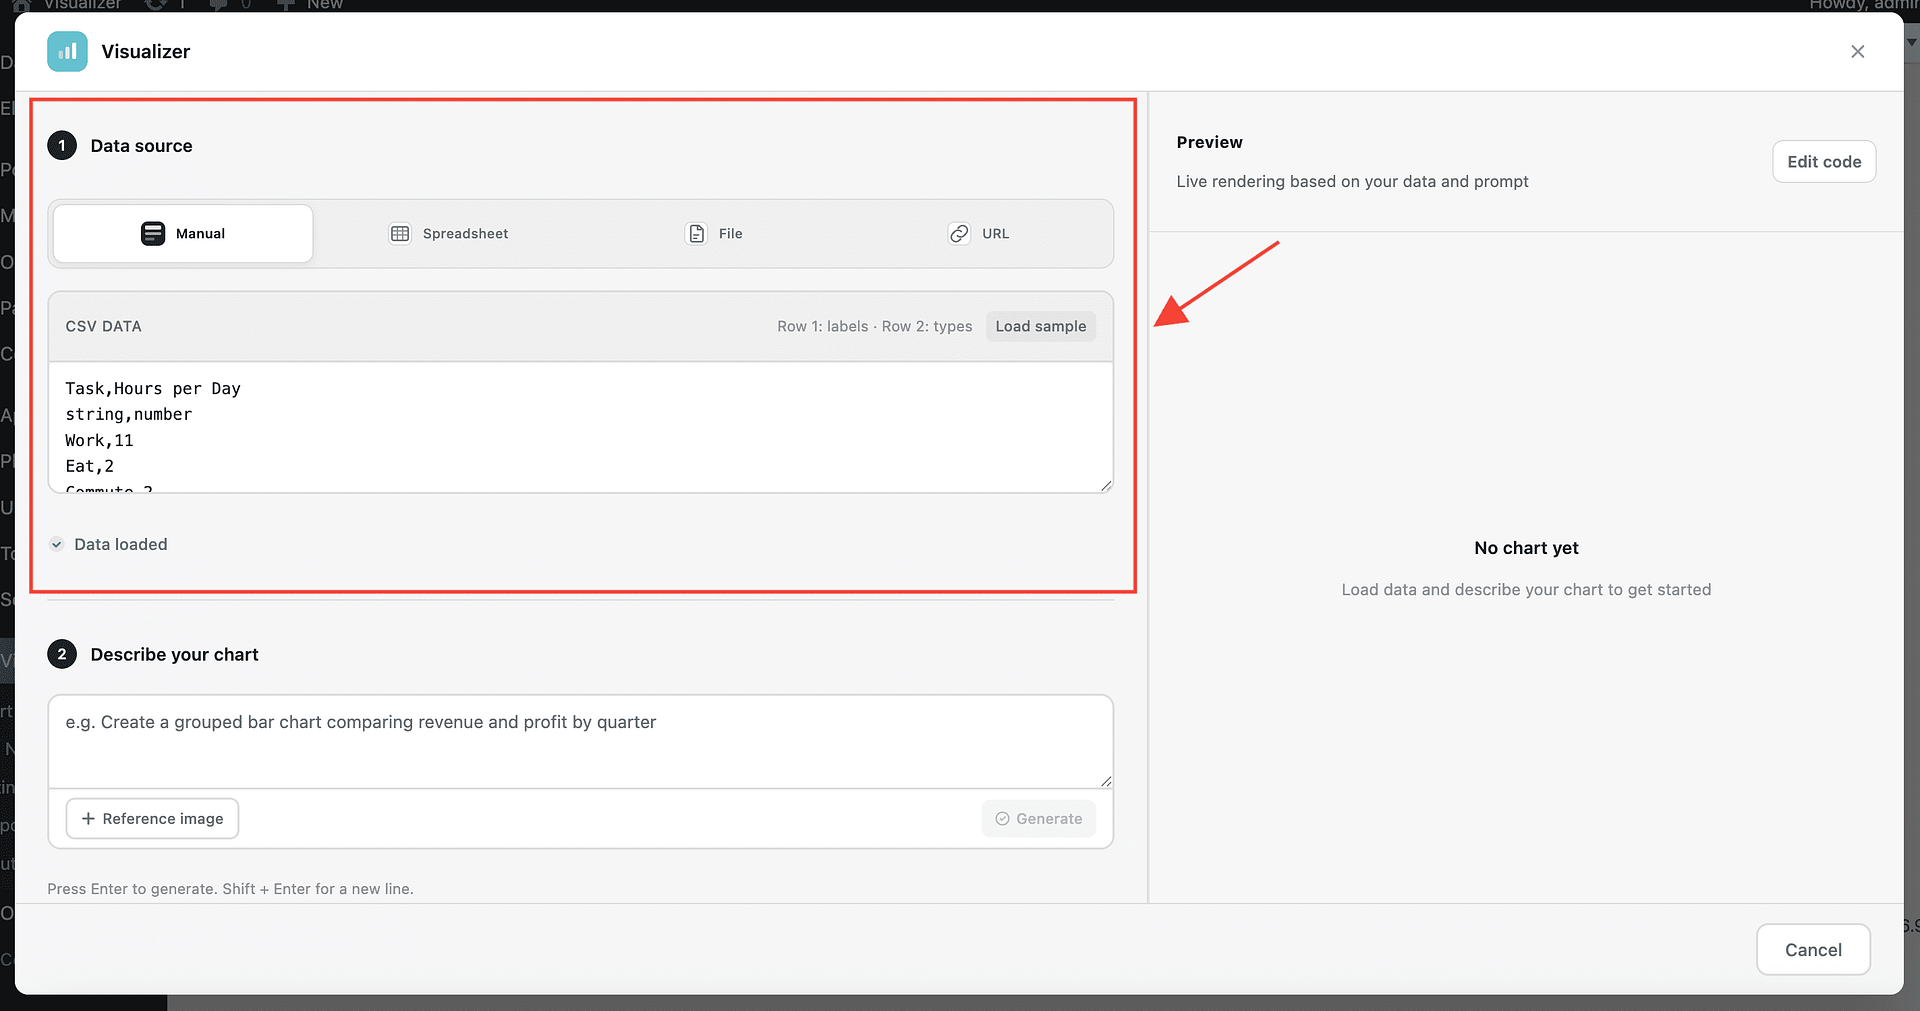
4. Load your data using one of the available options:
- Upload a file — import a CSV or XLSX spreadsheet from your computer.
- URL — provide a direct link to a remote CSV or XLSX file.
- Manual entry — use the built-in spreadsheet to enter data by hand.
5. In the prompt field, describe the chart you want to create in plain language. Be as specific as you can about chart type, colors, axes, and the relationship you want to visualize.
Example: "Create a multi-colored bubble chart showing the relationship between GDP and Life Expectancy"
6. Click Generate. The AI reads your data and prompt, then generates D3.js code to render the chart. A preview appears in the panel.
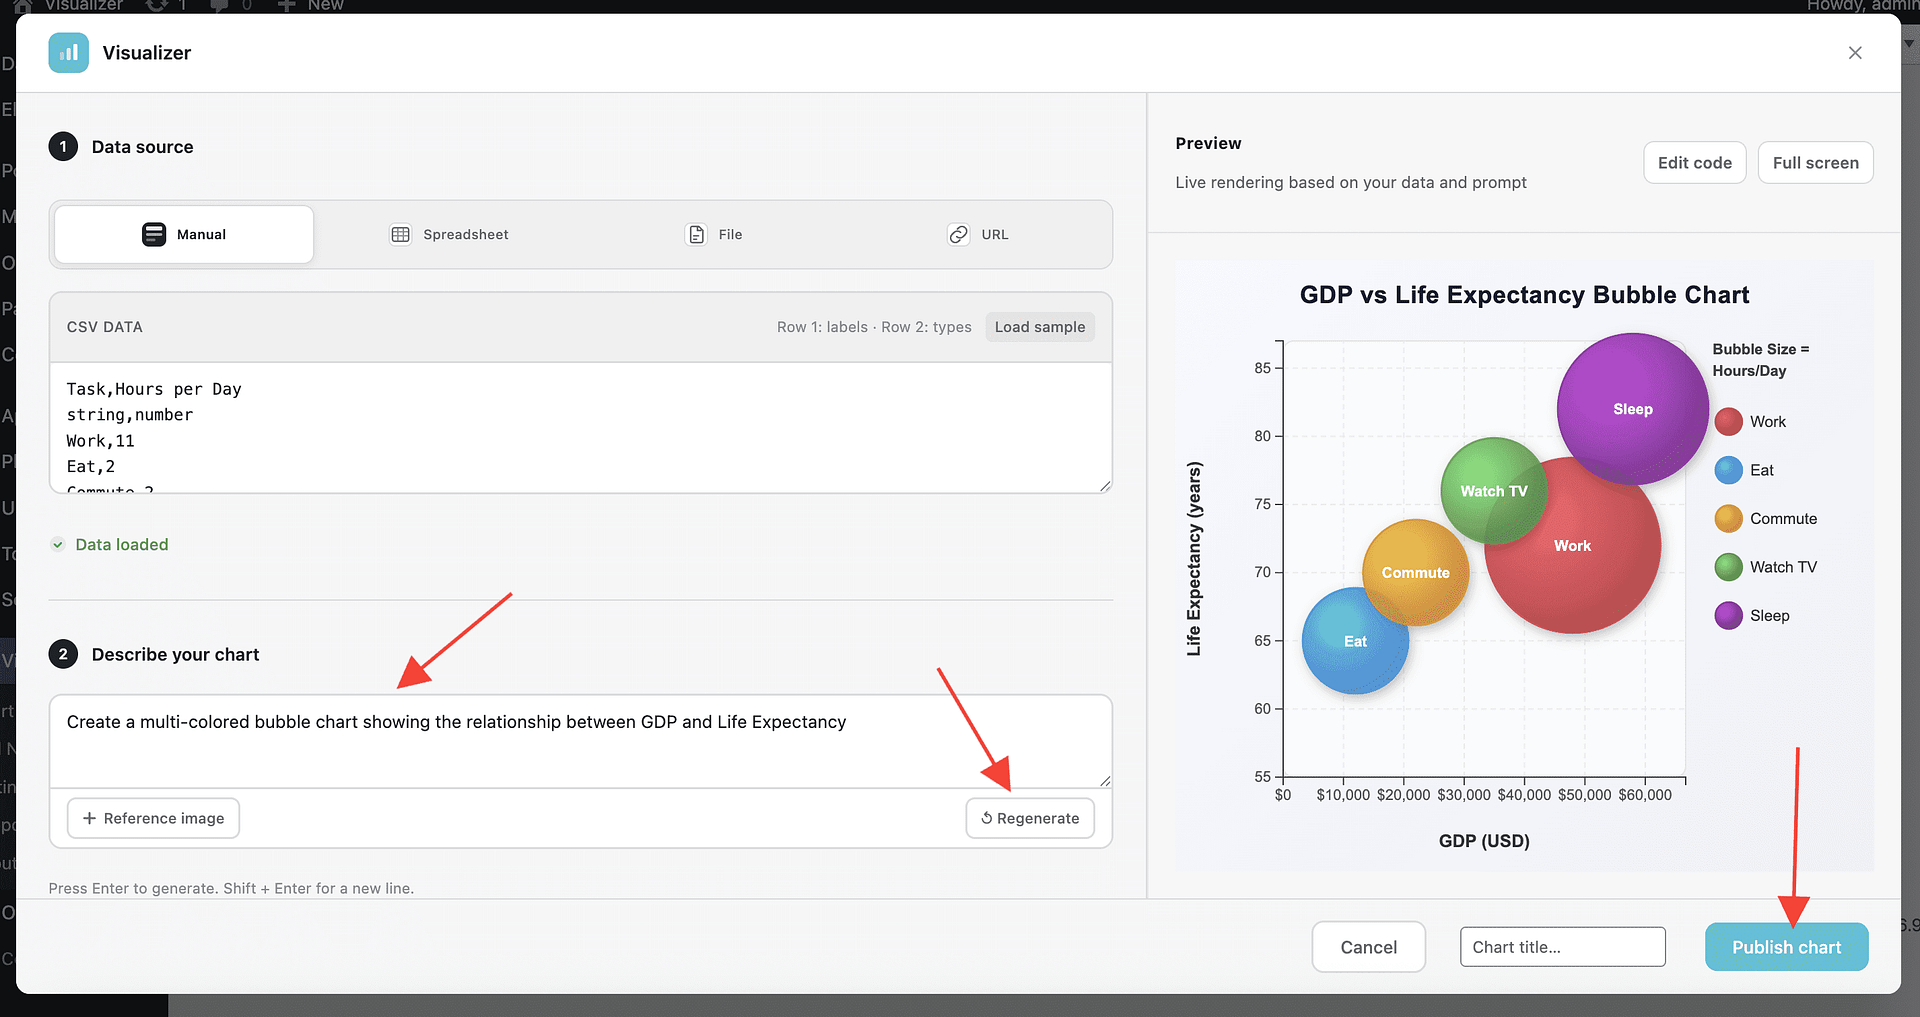
7. Review the preview. If the result isn't quite right, update the prompt and click Generate again to refine the chart. You can adjust colors, layout, labels, axis ranges, or chart type — just describe the change in your prompt.
8. When you're satisfied with the chart, click Publish Chart to add it to the Visualizer Library.
💡 Tip: AI charts use D3.js, which offers significantly more layout flexibility than standard Google Charts or Chart.js chart types. For complex or highly specific designs, more detailed prompts will produce better results — try describing the exact visual style, color scheme, and data relationship you want to highlight.
Embedding the Chart in a Post or Page
Once saved, your AI-generated chart works exactly like any other Visualizer chart.
1. In the Chart Library, locate your chart and click the shortcode icon to copy its shortcode (e.g., [visualizer id="123"]).
2. Open the post or page where you want to display the chart.
3. To embed using the block editor:
- Click the ➕ button to add a new block.
- Search for Visualizer Chart and select it.
- Choose your saved chart from the list.
4. To embed using a shortcode:
- Add a Shortcode block.
- Paste the copied shortcode into it.
5. Click Update or Publish to save the page.
📝 Note: For more information on displaying charts, see How can I display a chart? and How to display a chart in Elementor.
Troubleshooting
Chart doesn't render after clicking Generate
- Make sure your data is fully loaded before clicking Generate. If you used a URL, confirm the file is publicly accessible.
- Check that your data contains at least two columns. The AI Builder needs structured data to generate a chart.
- Try simplifying your prompt. Remove special instructions and start with a basic chart type, then add details once it renders.
Prompt gives unexpected results
- Be more specific. Instead of "show me a chart", try "create a vertical bar chart with months on the X axis and revenue on the Y axis, using blue bars".
- If the chart type is wrong, explicitly name it in your prompt (e.g., "scatter plot", "line chart", "pie chart").
- If colors or labels are off, describe them directly: "use distinct colors for each country" or "label each data point with its value".
How to edit the chart after saving
1. Go to Visualizer > Chart Library.
2. Hover over the chart and click Edit.
3. Update your prompt in the AI Builder panel and click Generate to regenerate the chart with the new instructions.
4. Click Save Chart to apply the changes.
⚠️ Important: Regenerating a chart replaces the previous D3.js output entirely. If you made manual adjustments outside the prompt, those will be overwritten when you click Generate again.