How to display a chart in Elementor
📝 Note: This feature is part of Visualizer: Charts and Graphs. Take a look at the complete documentation of the plugin here.
Visualizer provides a native Elementor widget that lets you embed your charts directly in the Elementor editor — no shortcode needed.
In this article
Using the Elementor Widget
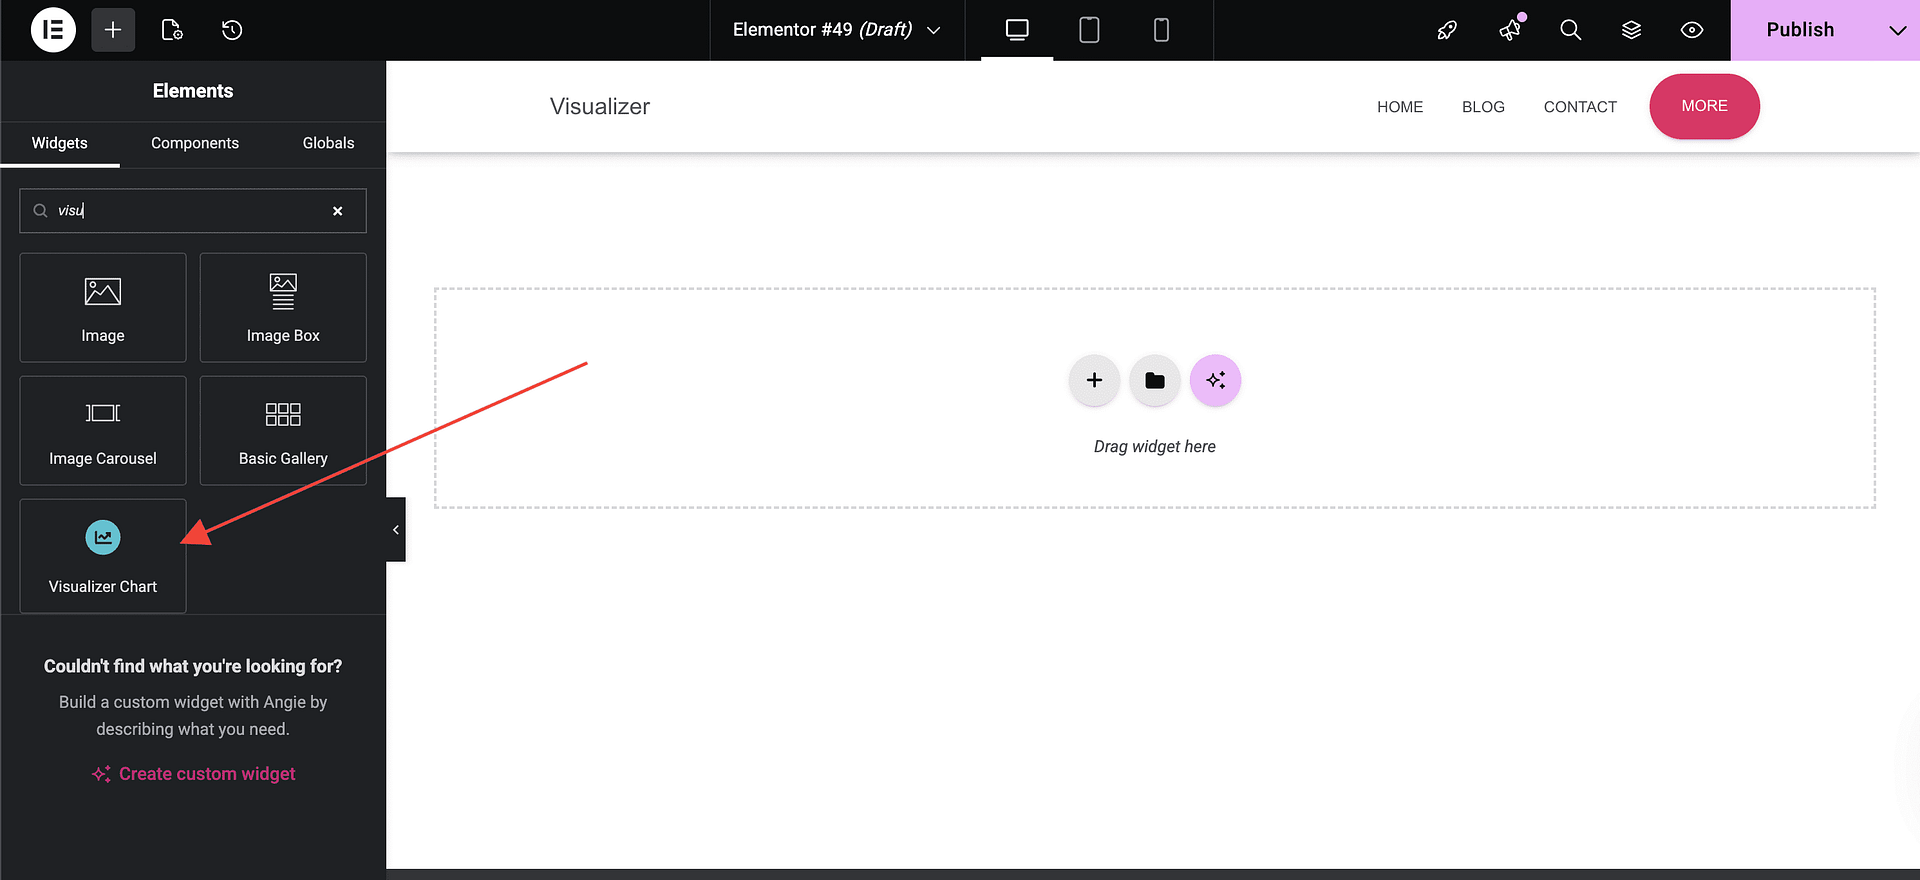
- Open your page in the Elementor Editor.
- In the elements panel on the left, search for "Visualizer Chart".
- Drag the widget onto your page.
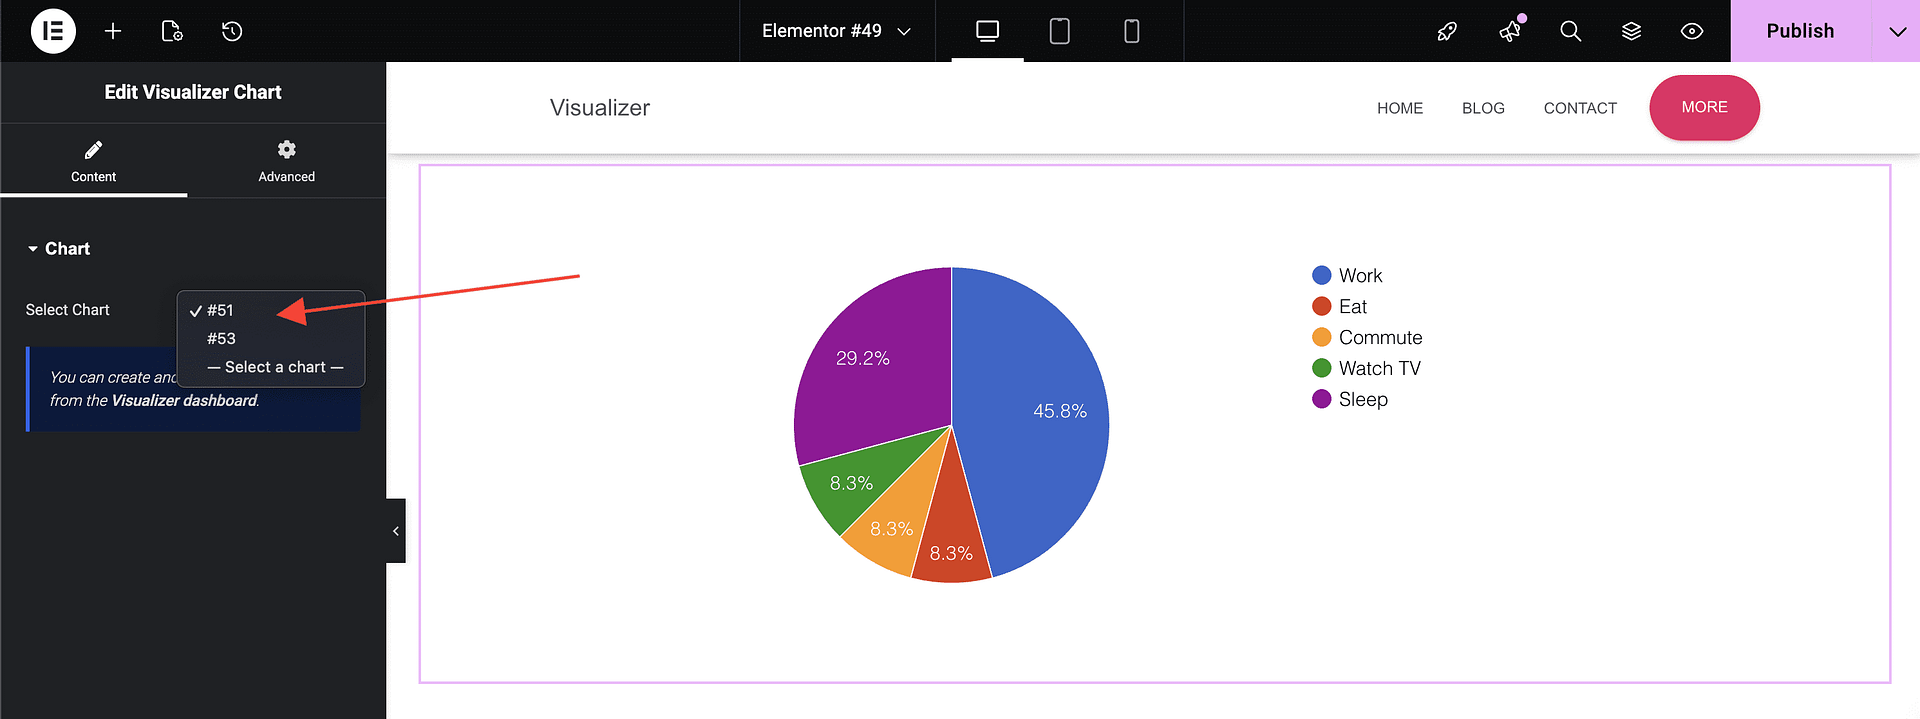
- In the widget settings under the Content tab, use the Select Chart dropdown to choose one of your existing charts.
- The chart renders instantly in the Elementor preview area.
📝 Note: If you have not created any charts yet, the widget will display a notice with a link to the Visualizer dashboard where you can create your first chart.
Verifying the chart displays correctly
After selecting a chart, check the Elementor canvas to confirm the chart appears as expected. If the chart does not render, try clicking Regenerate or refreshing the Elementor editor. Once you are satisfied, click Update or Publish to save the page.
Other ways to display a chart
In addition to the Elementor widget, Visualizer supports other display methods:
- Shortcode — copy the chart shortcode from the Chart Library and paste it into any Shortcode block.
- Gutenberg block — use the Visualizer Chart block in the WordPress block editor.
For details on these methods, see How can I display a chart?.