Visualizer: Charts and Graphs Documentation
Visualizer is a powerful tool that can easily be used to create, manage and embed interactive charts into your WordPress posts and pages.
The plugin uses Google Visualization API to render charts, which supports:
- 🖇️ cross-browser compatibility
- 📱 cross-platform portability to iOS and Android
- ♿ accessibility for screen readers and assistive technologies
📝 Note: Exciting news! We do offer a demo for Visualizer, allowing you to explore its features firsthand before making a decision. Take your time to test it out and see if it fits your needs perfectly here.
📩 Download and Install
To download and install the Visualizer plugin, make sure you follow the steps below:
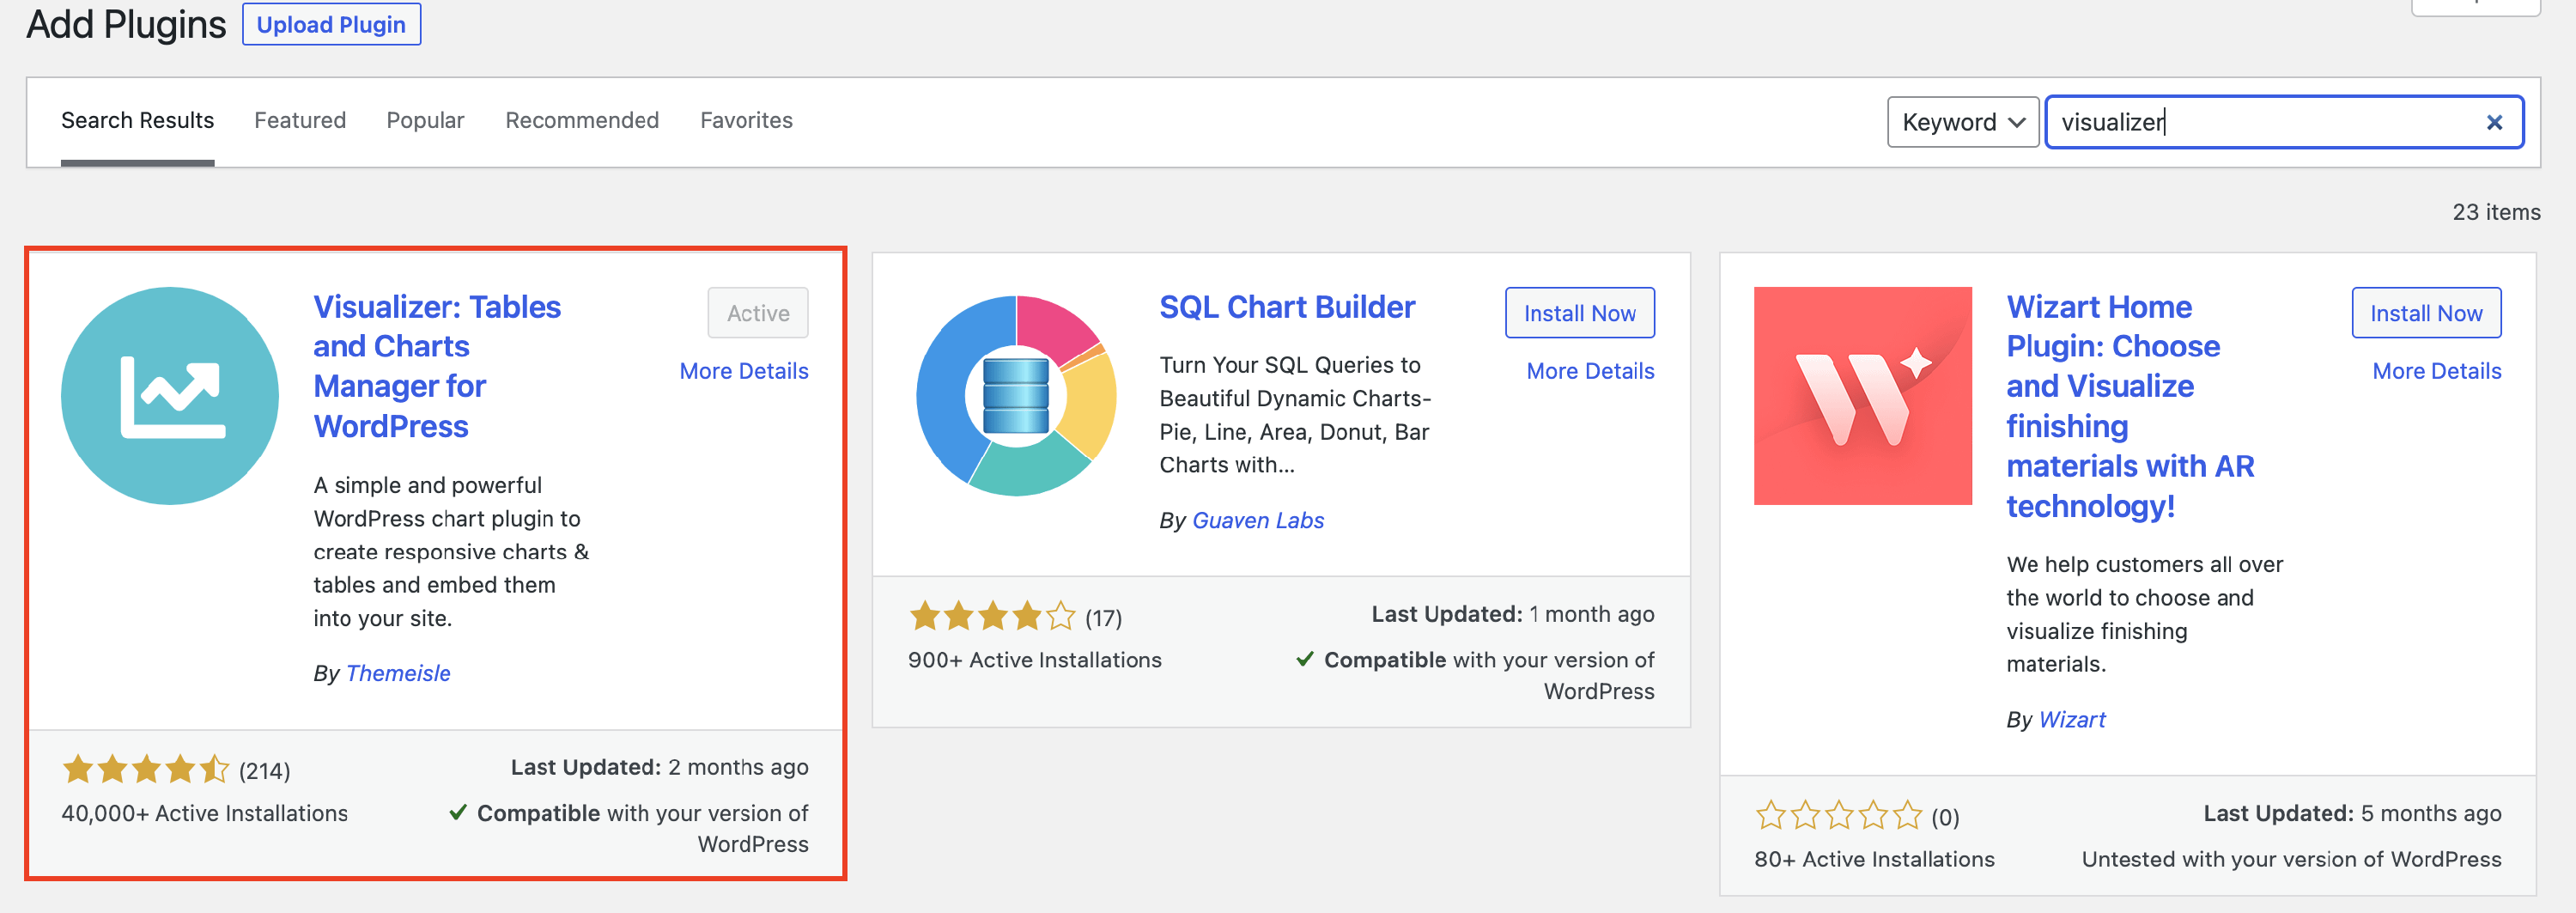
1. Navigate to the WordPress Dashboard > Plugins.
2. Click the Add New button and type in the Search Bar " Visualizer".
3. When the plugin appears, click on the Install button and then on Activate.
📝 Note: These instructions are just for Visualizer. To install the purchased Visualizer Pro, make sure you follow these instructions.
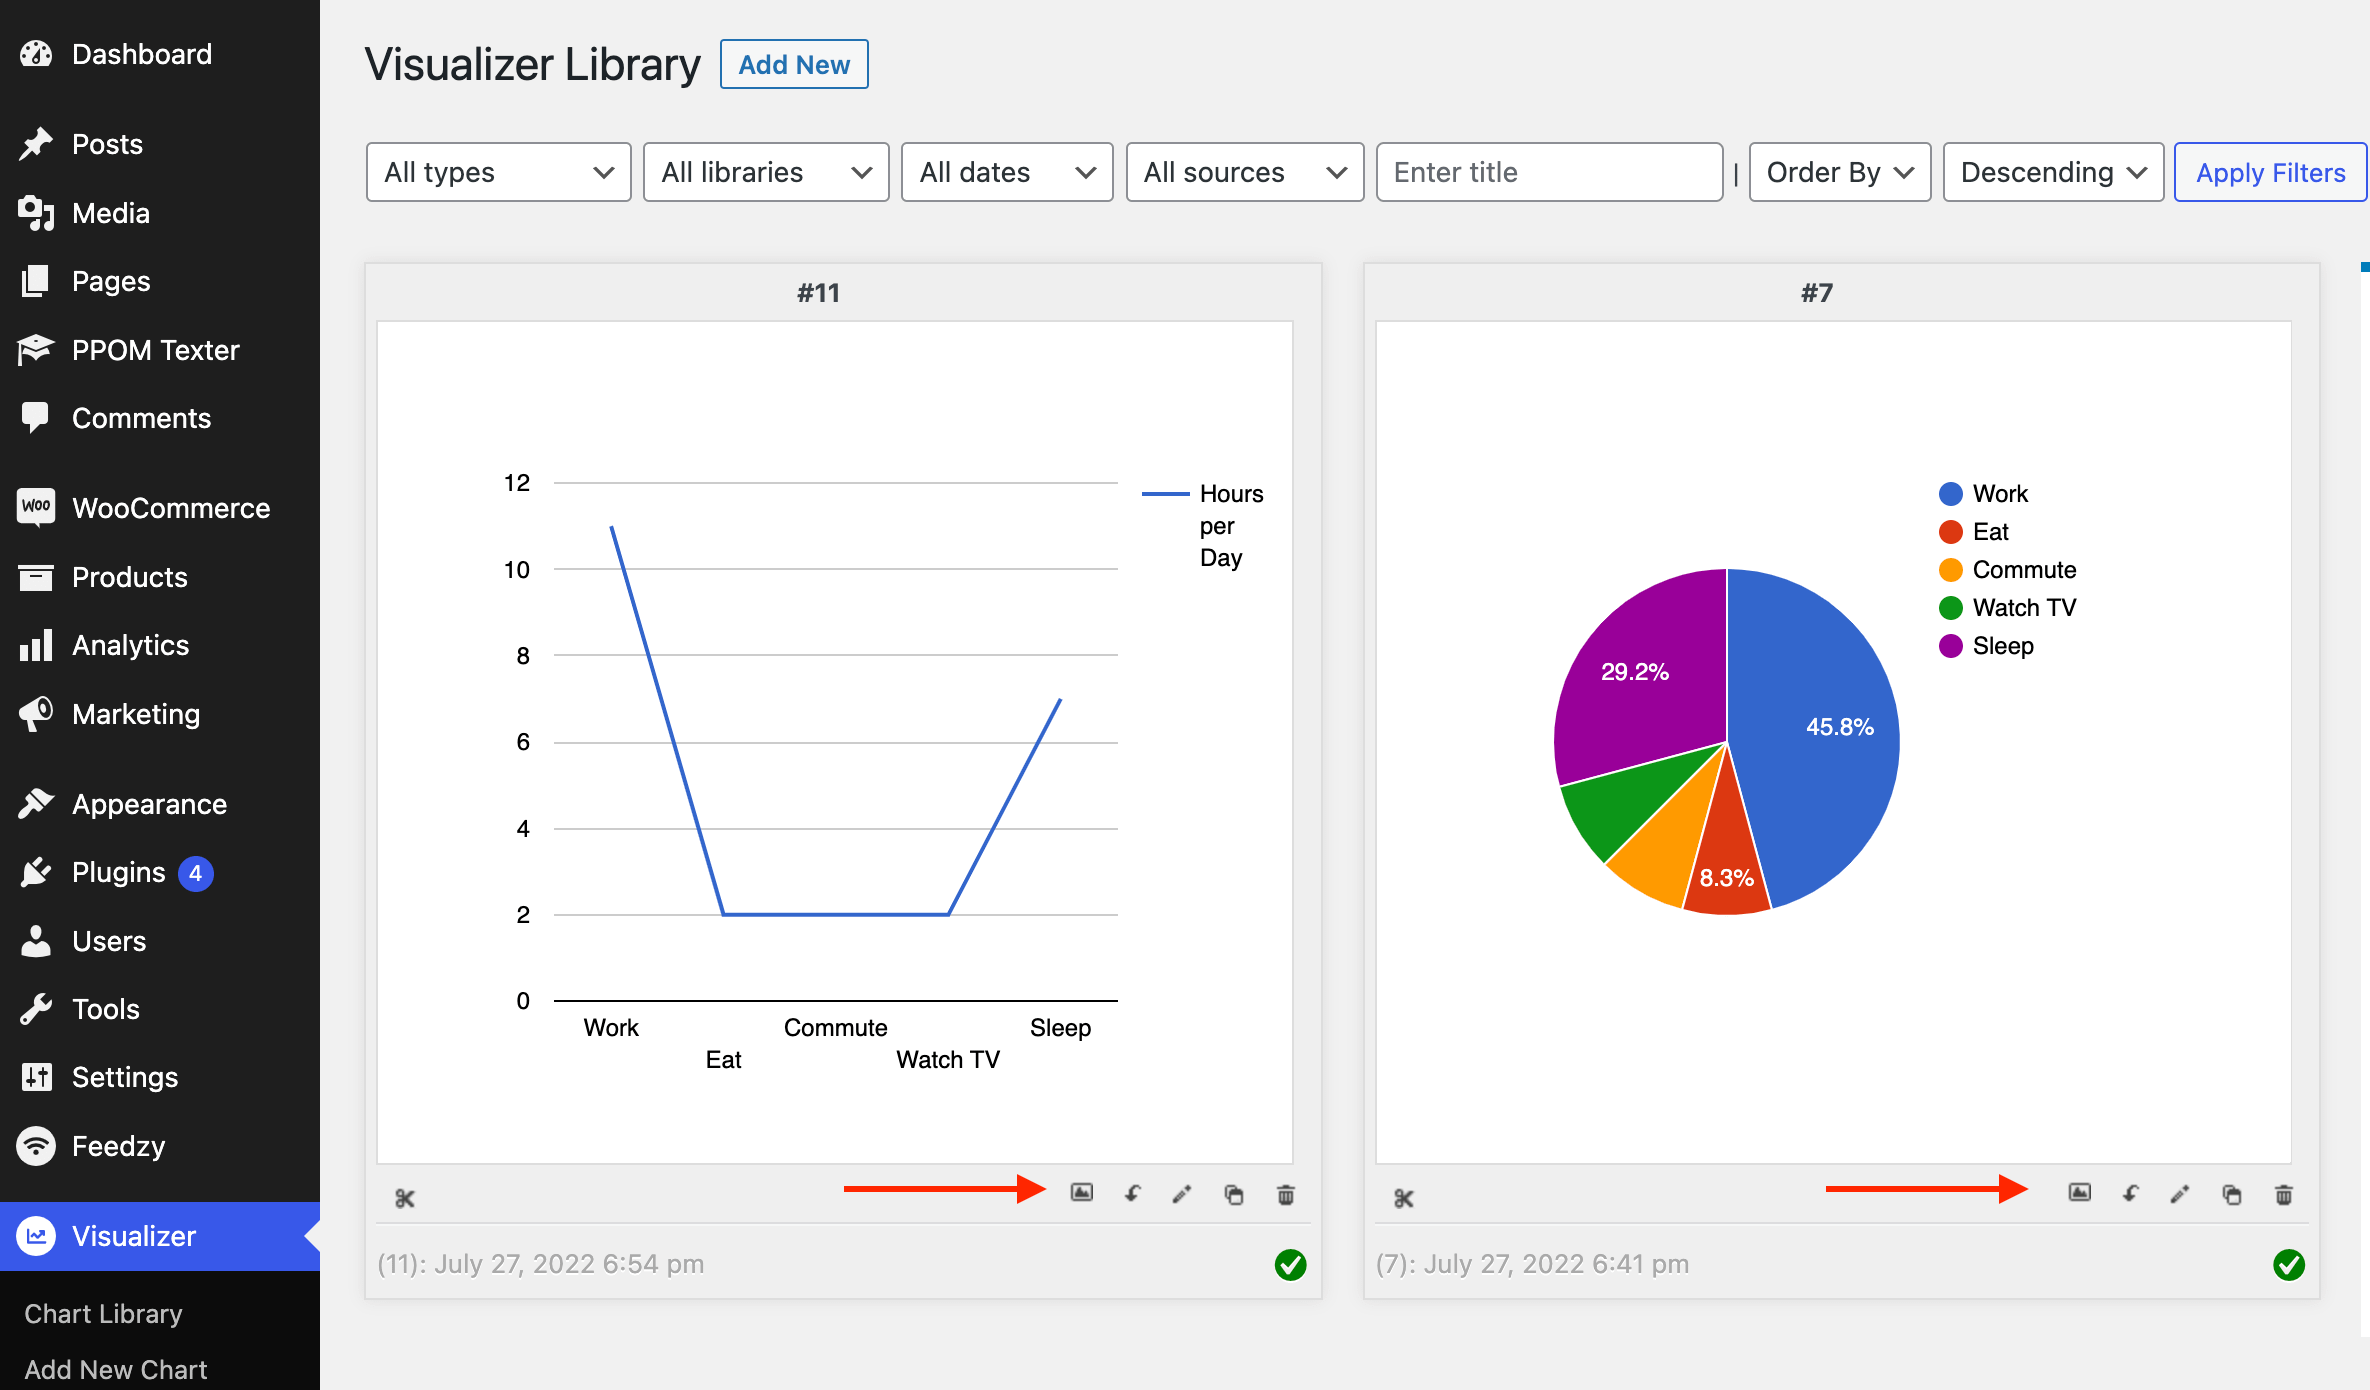
🧰 Managing the Charts
There are many available operations with Charts and Graphs within the Visualizer plugin directly from the Visualizer > Charts Library:
| Create a Chart | Delete a Chart | Customize a chart | Display a Chart | Clone a chart | Export a chart |
Before creating the chart, please note that by default, the plugin saves an image of the chart in your Media Library. The purpose of this is to be available for download in case you enable it in the front-end actions and for rendering the chart as an image on the AMP version of the page, which is done automatically. To prevent creating a copy of the chart as an image in your media library, just uncheck this box in the chart settings ( 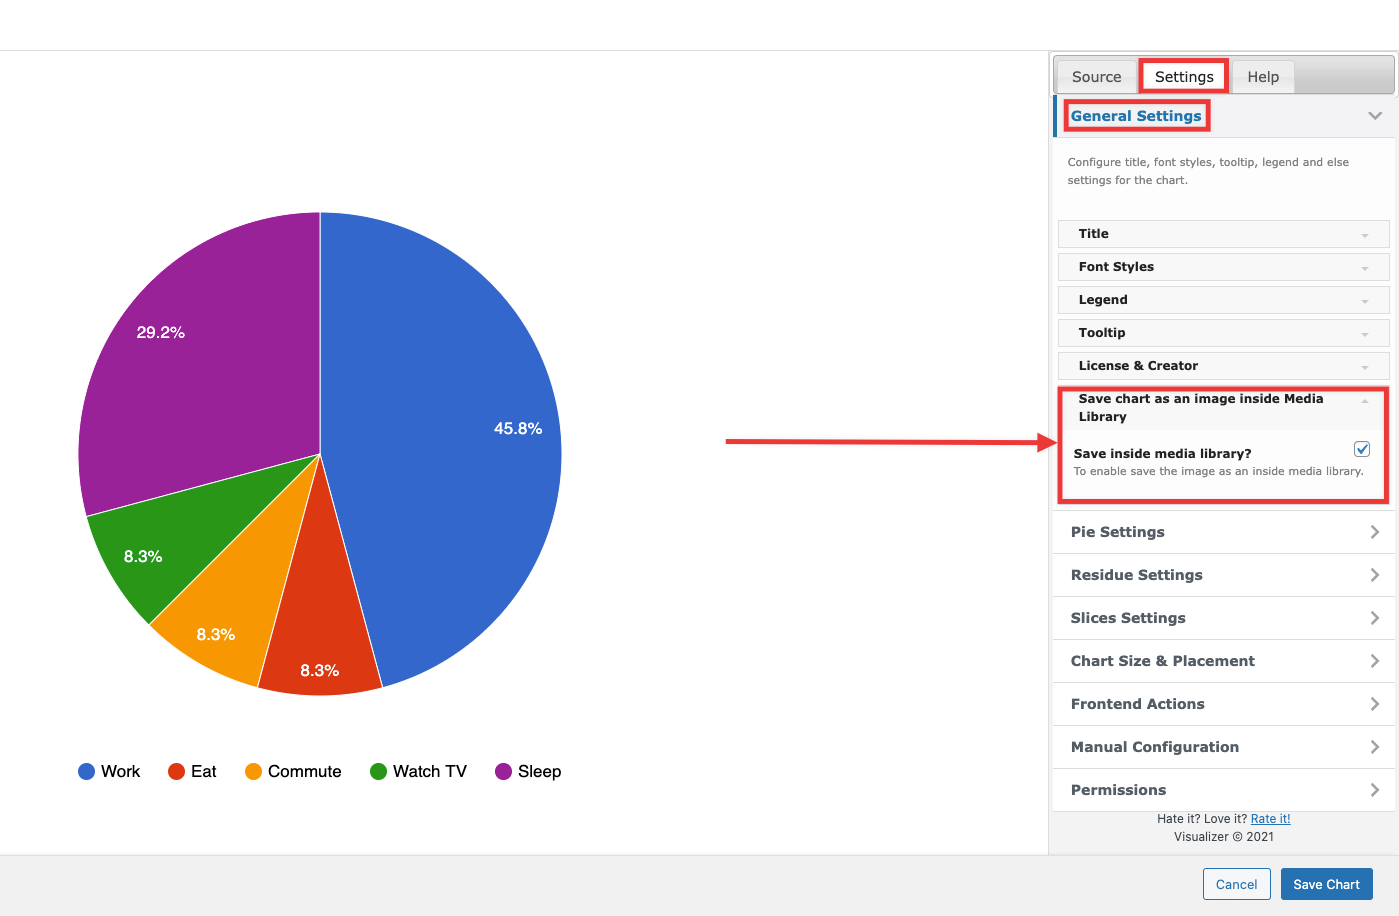 click for image). Please note that if AMP is enabled on your website, this option is automatically turned on.
📝 Note: The chart's legend position can be adjusted according to your needs. Check this doc for further information about this.
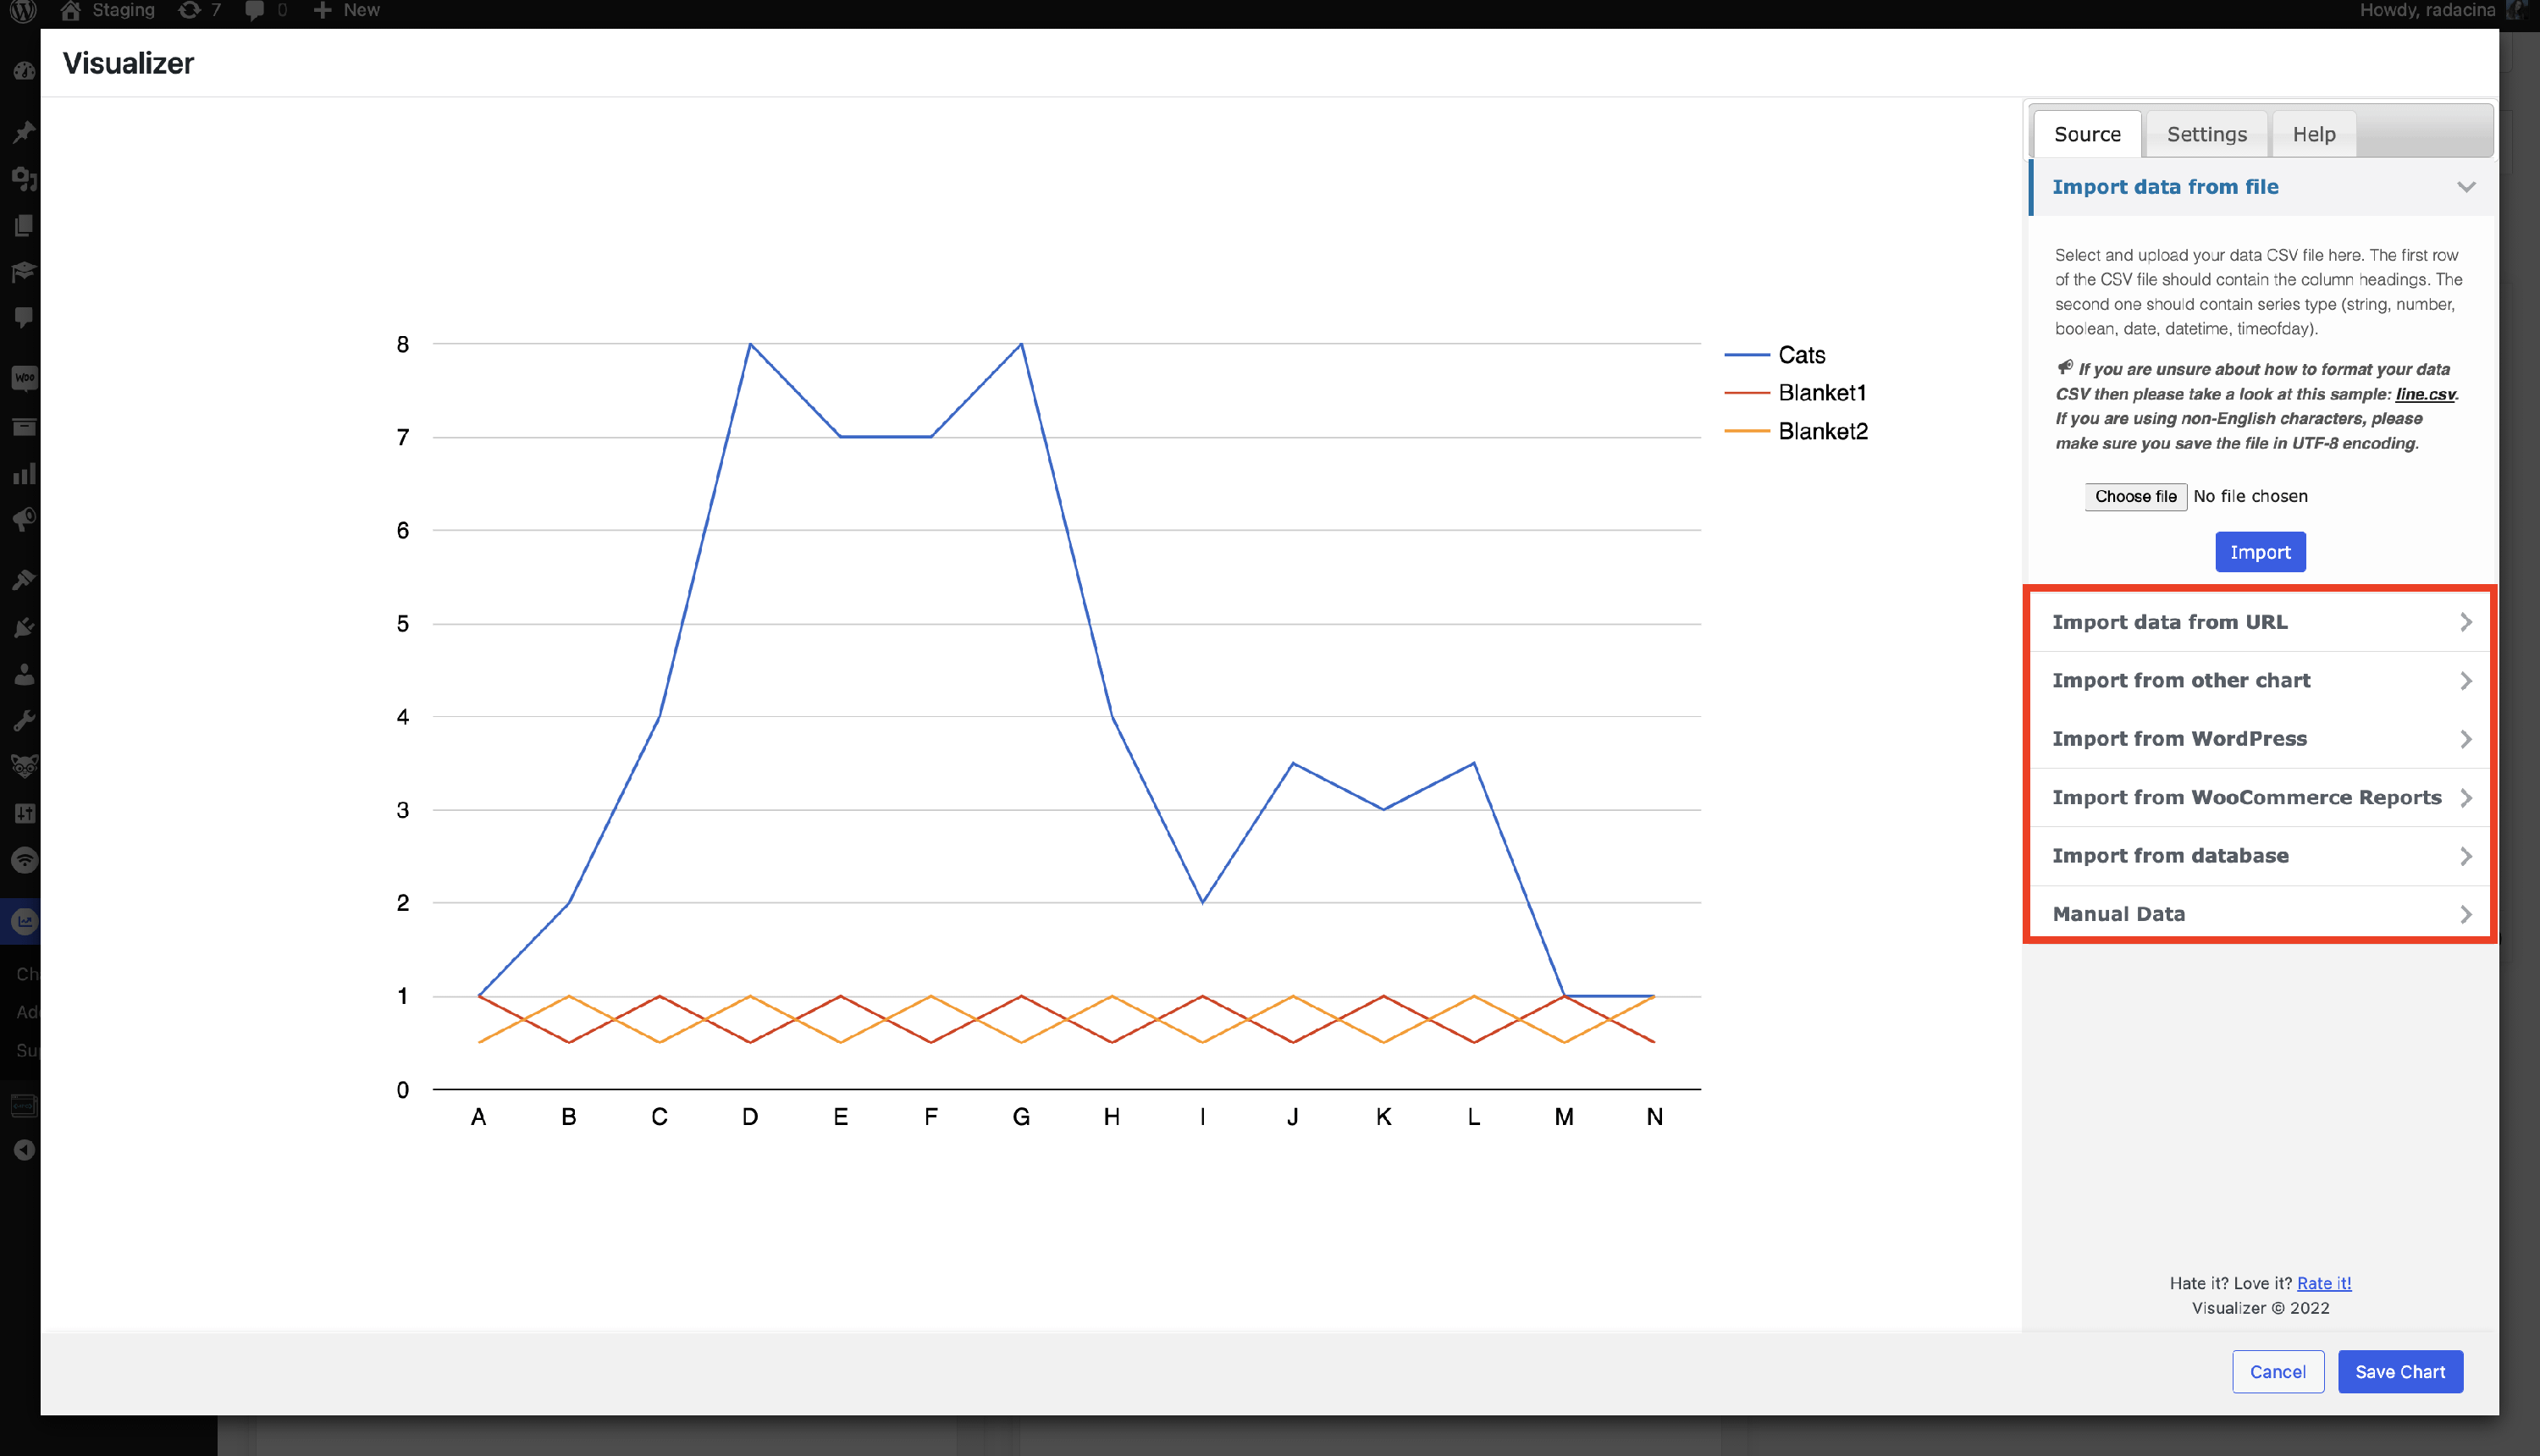
⚙️Available Data Sources of Charts
One of the most important features of the Visualizer plugin is that it can be a time-saver, due to the import function.
Below is a table with the import possibilities and the plans that include them:
| Type | Free | Personal | Plus |
| Manual Data | Yes | Text/Simple/Excel | Text/Simple/Excel |
| Import from a local uploaded .csv or .xlsx file | - | Yes | Yes |
| Import from an online resourse - URL (.csv file or .xlsx file) | - | One-time/10 minutes/Each hour/12 hours/day/3 days | One-time/10 minutes/Each hour/12 hours/day/3 days |
| Import from an online resource - URL (JSON file) | - | One-time/10 minutes/Each hour/12 hours/day/3 days | One-time/10 minutes/Each hour/12 hours/day/3 days |
| Import from WooCommerce Reports | - | Yes | Yes |
| Import from other charts (previously created ) | - | Yes | Yes |
| Import from WordPress | - | One-time | One-time/10 minutes/Each hour/12 hours/day/3 days |
| Import from database | - | One-time | One-time/10 minutes/Each hour/12 hours/day/3 days |
📝 Note: Visualizer allows the user to reflect upon the changes made through time by syncing the charts.
🗂 Charts Library
To access the Charts Library, navigate to Dashboard > Visualizer > Chart Library.
| Charts of the Free Version | Charts of the Pro version |
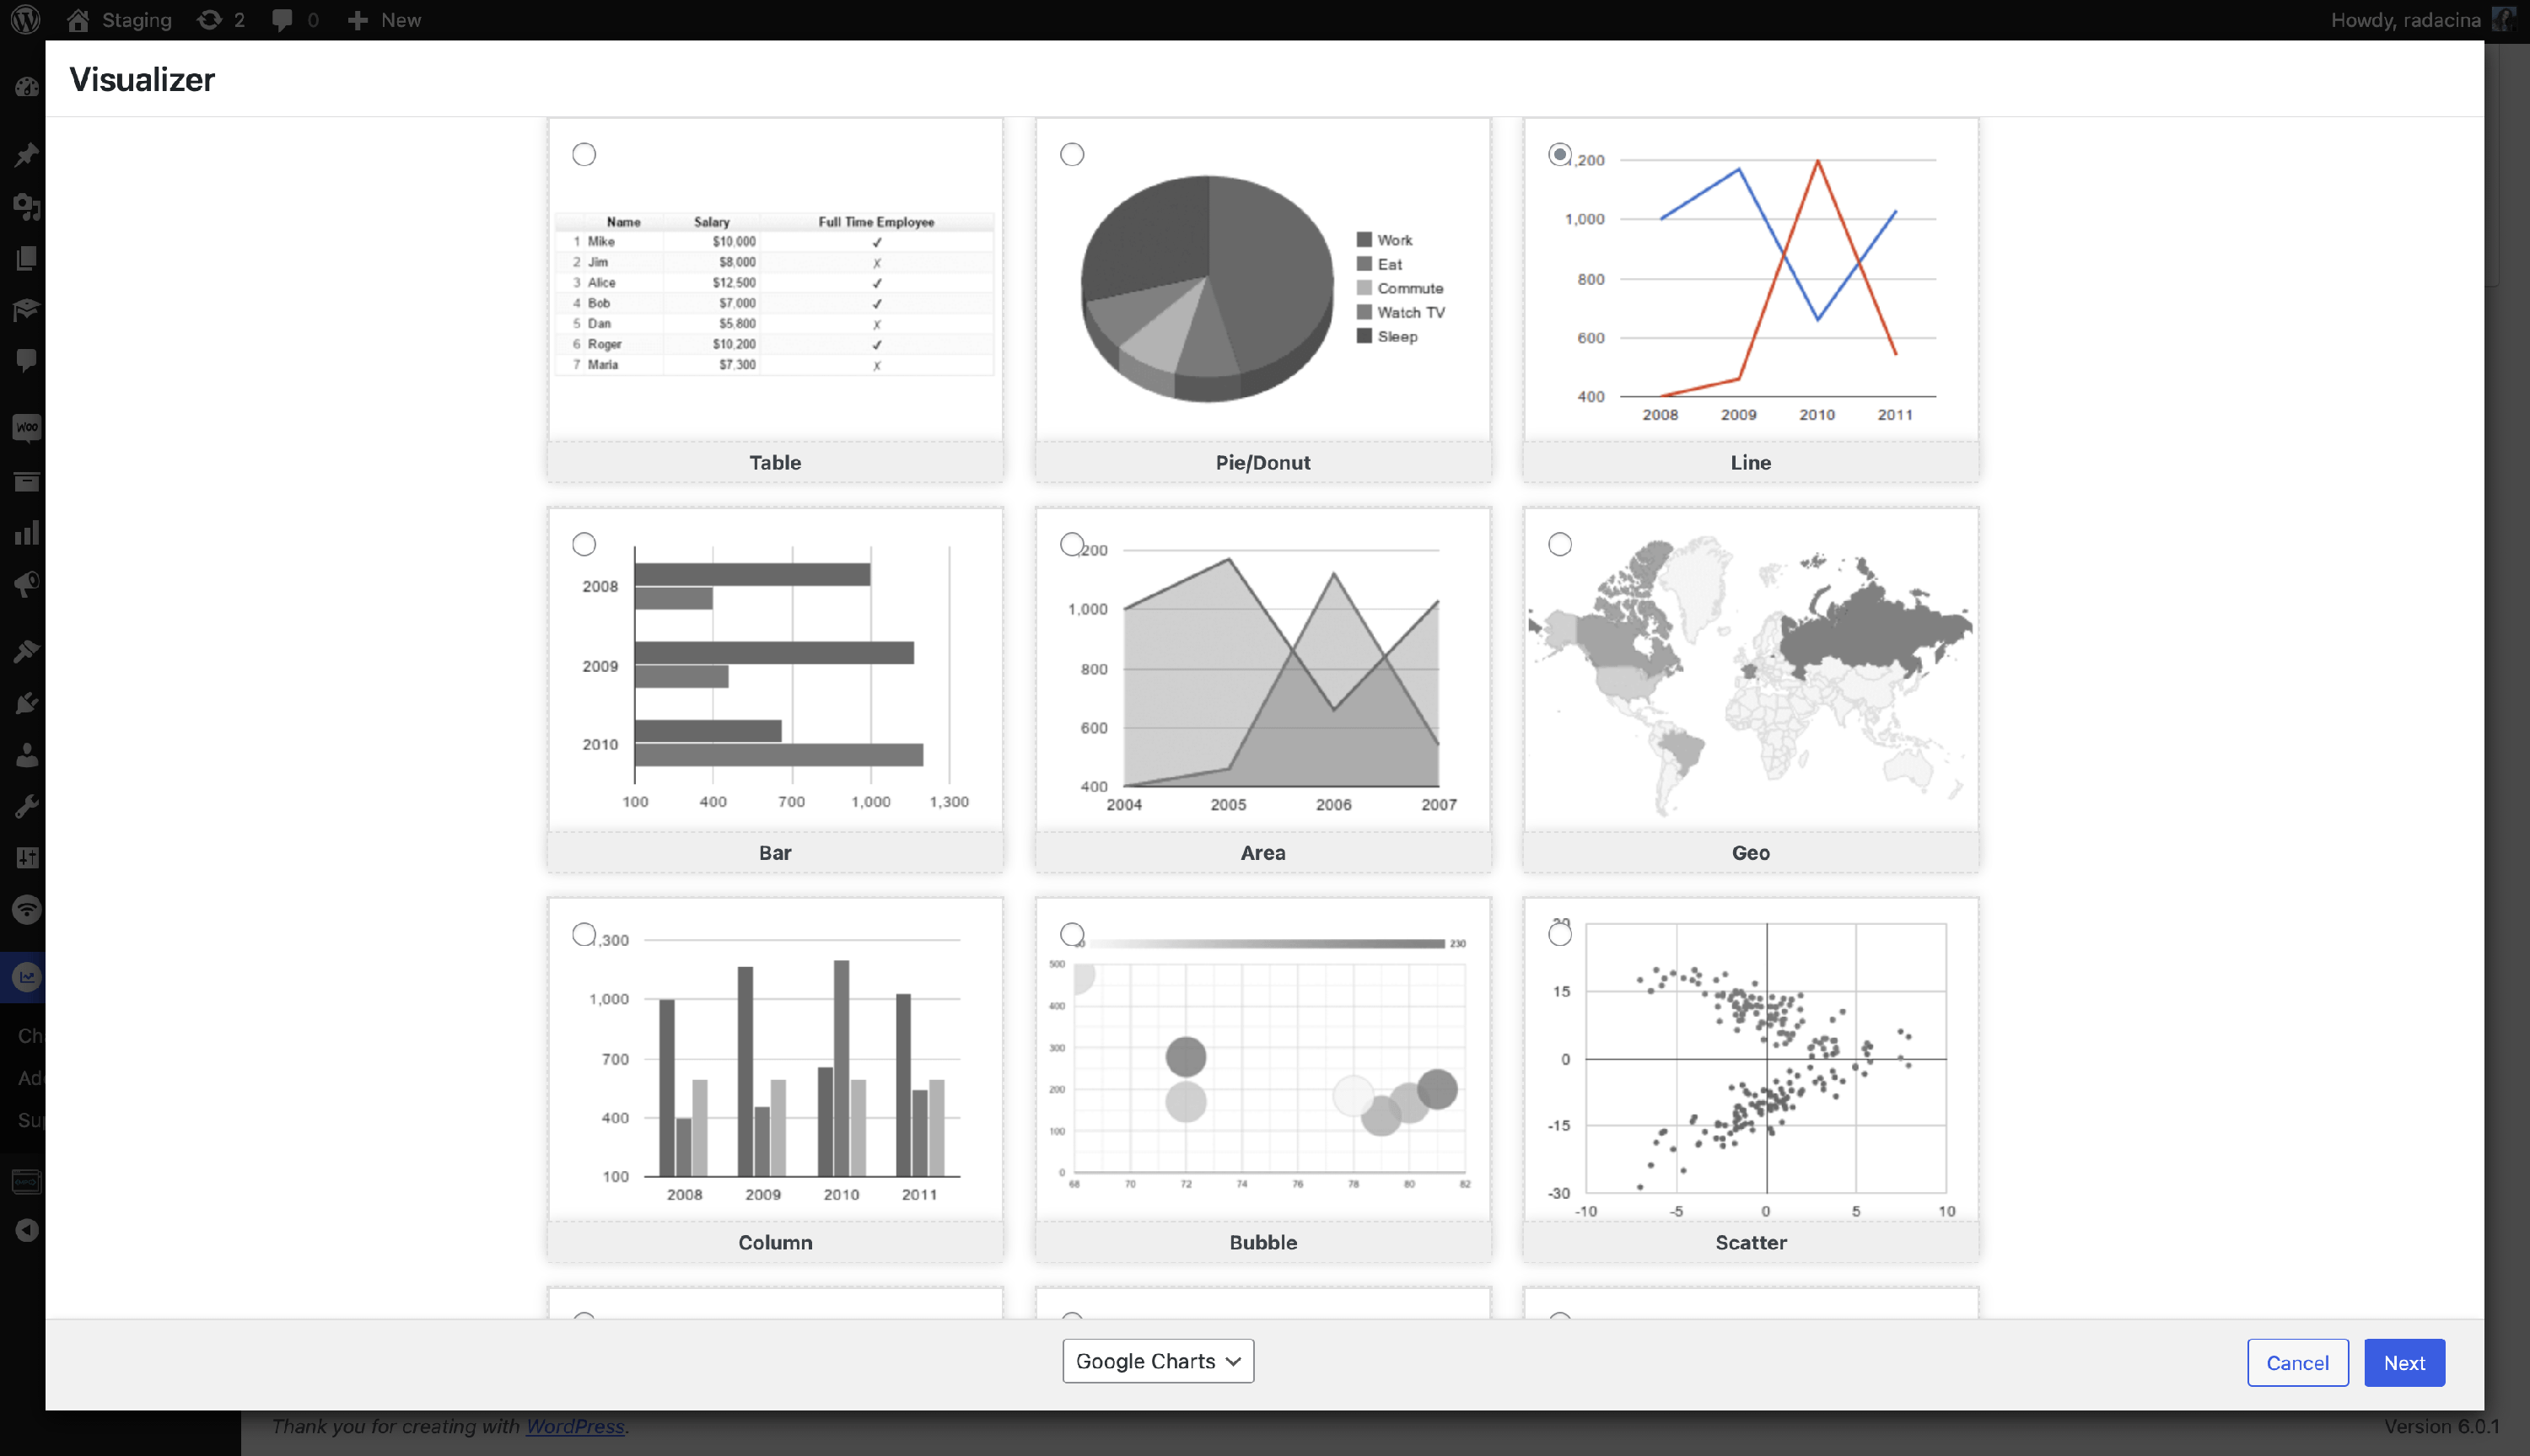
There are 15 chart types available in the Visualizer Library, optimized to address your data visualization needs, split into the Free Version and Pro Version, including:
- the popular DataTables library
- 12 Google charts
- 6 charts from Chart.js
Visualizer PRO Features
| Screen Options and Filters | Translate Visualizer's Data |
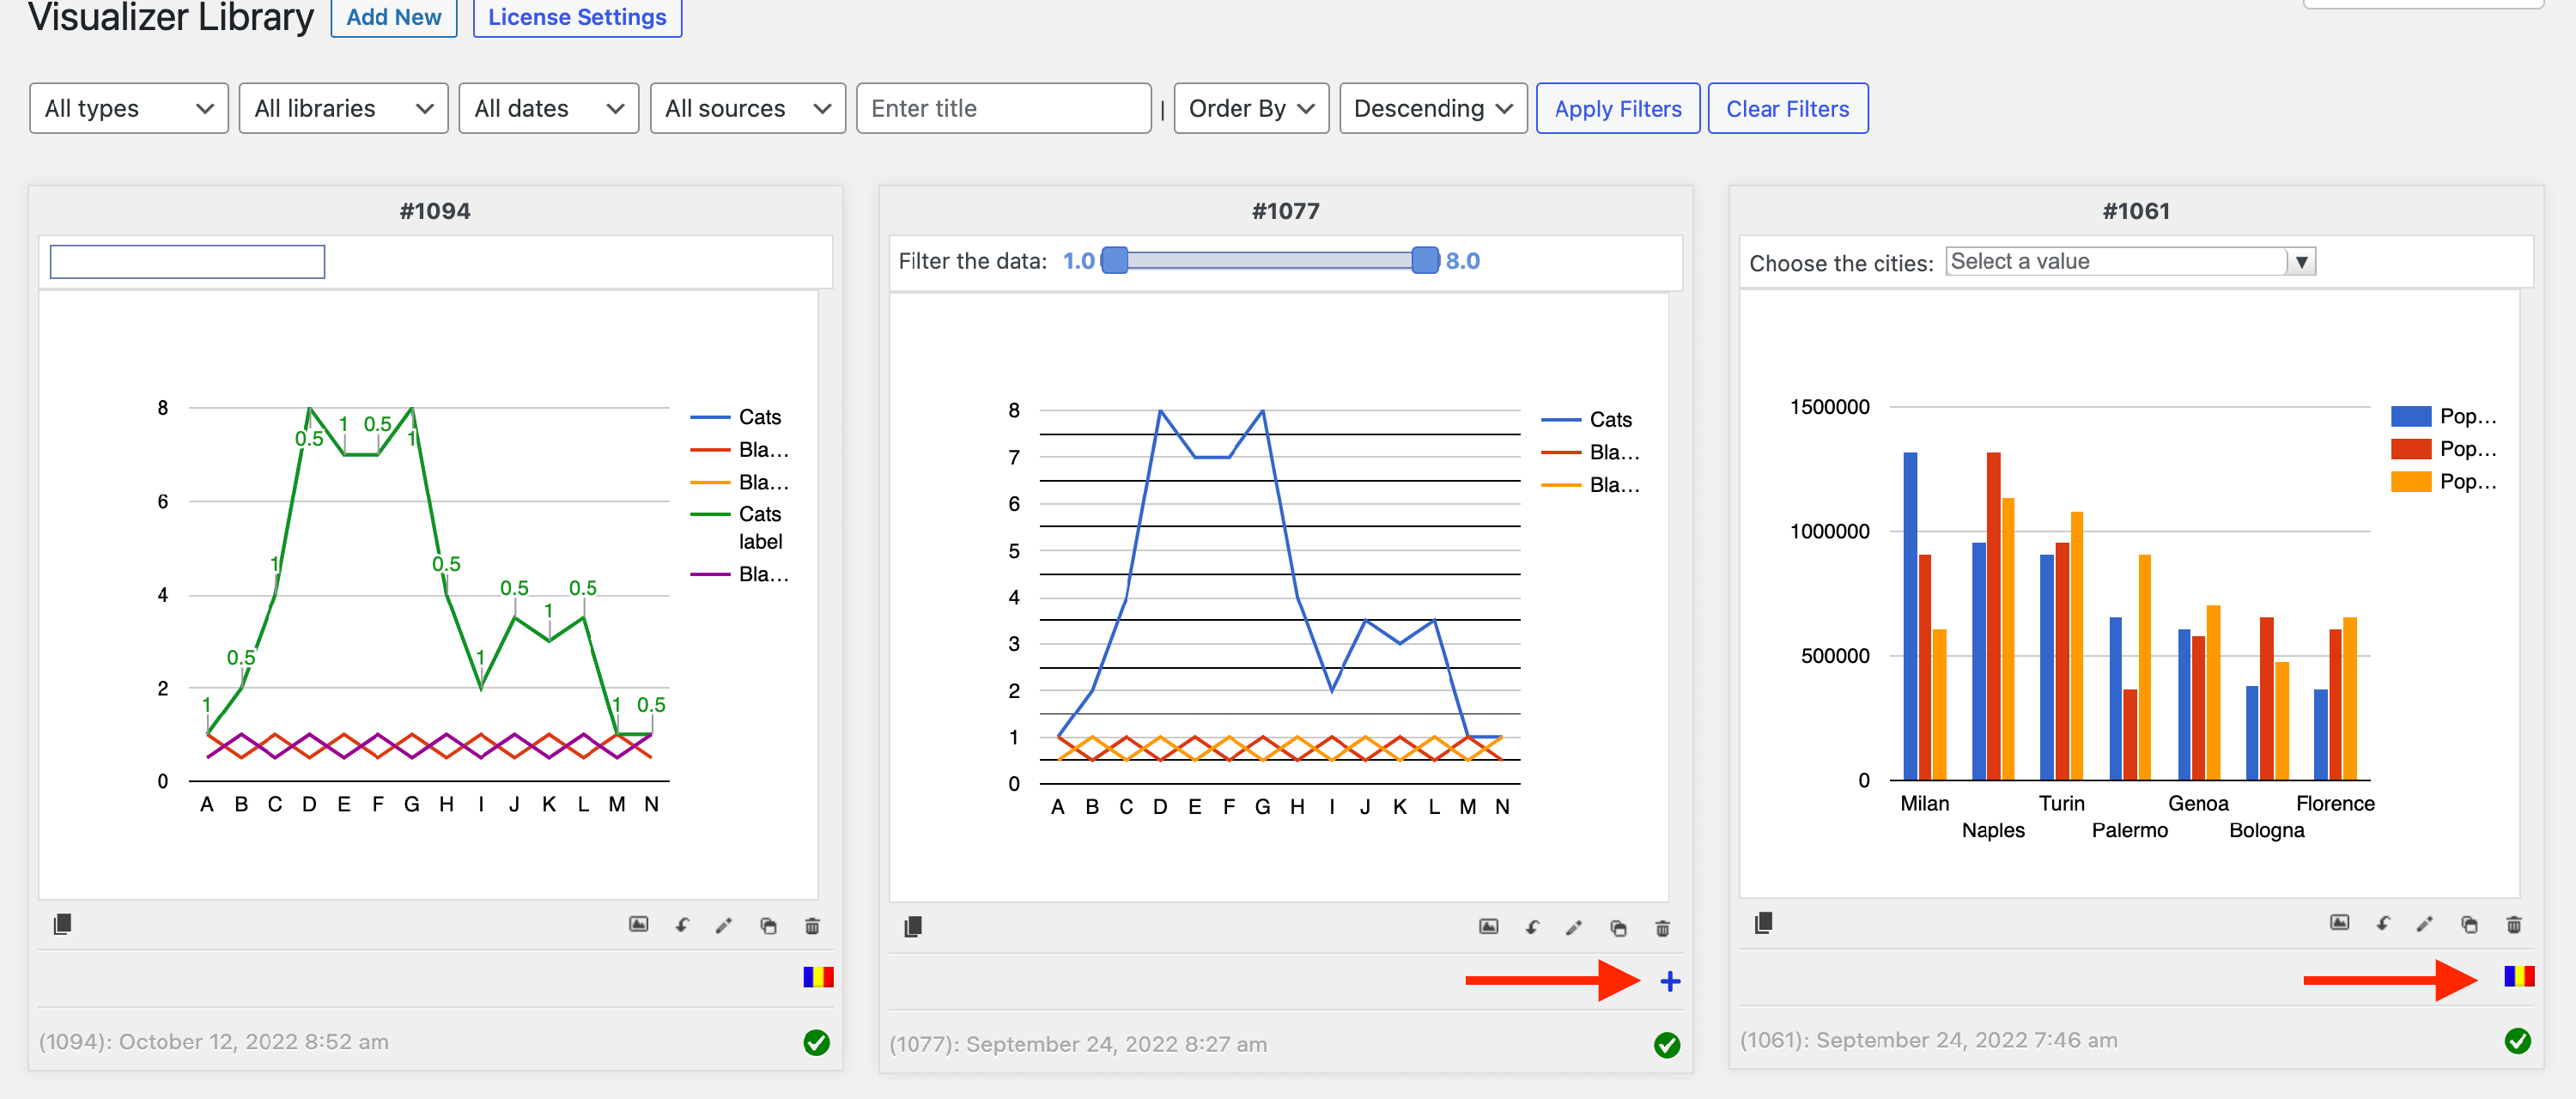
🧹 Screen Options and Filters
📝 Note: The premium version of Visualizer allows you to create interactive charts by adding filters.
To prevent a crowded library, you can choose a smaller number of charts to appear on each page:
1. Click on Screen Options on the top right side of the screen.
2. Add your preferred number, then click Apply.
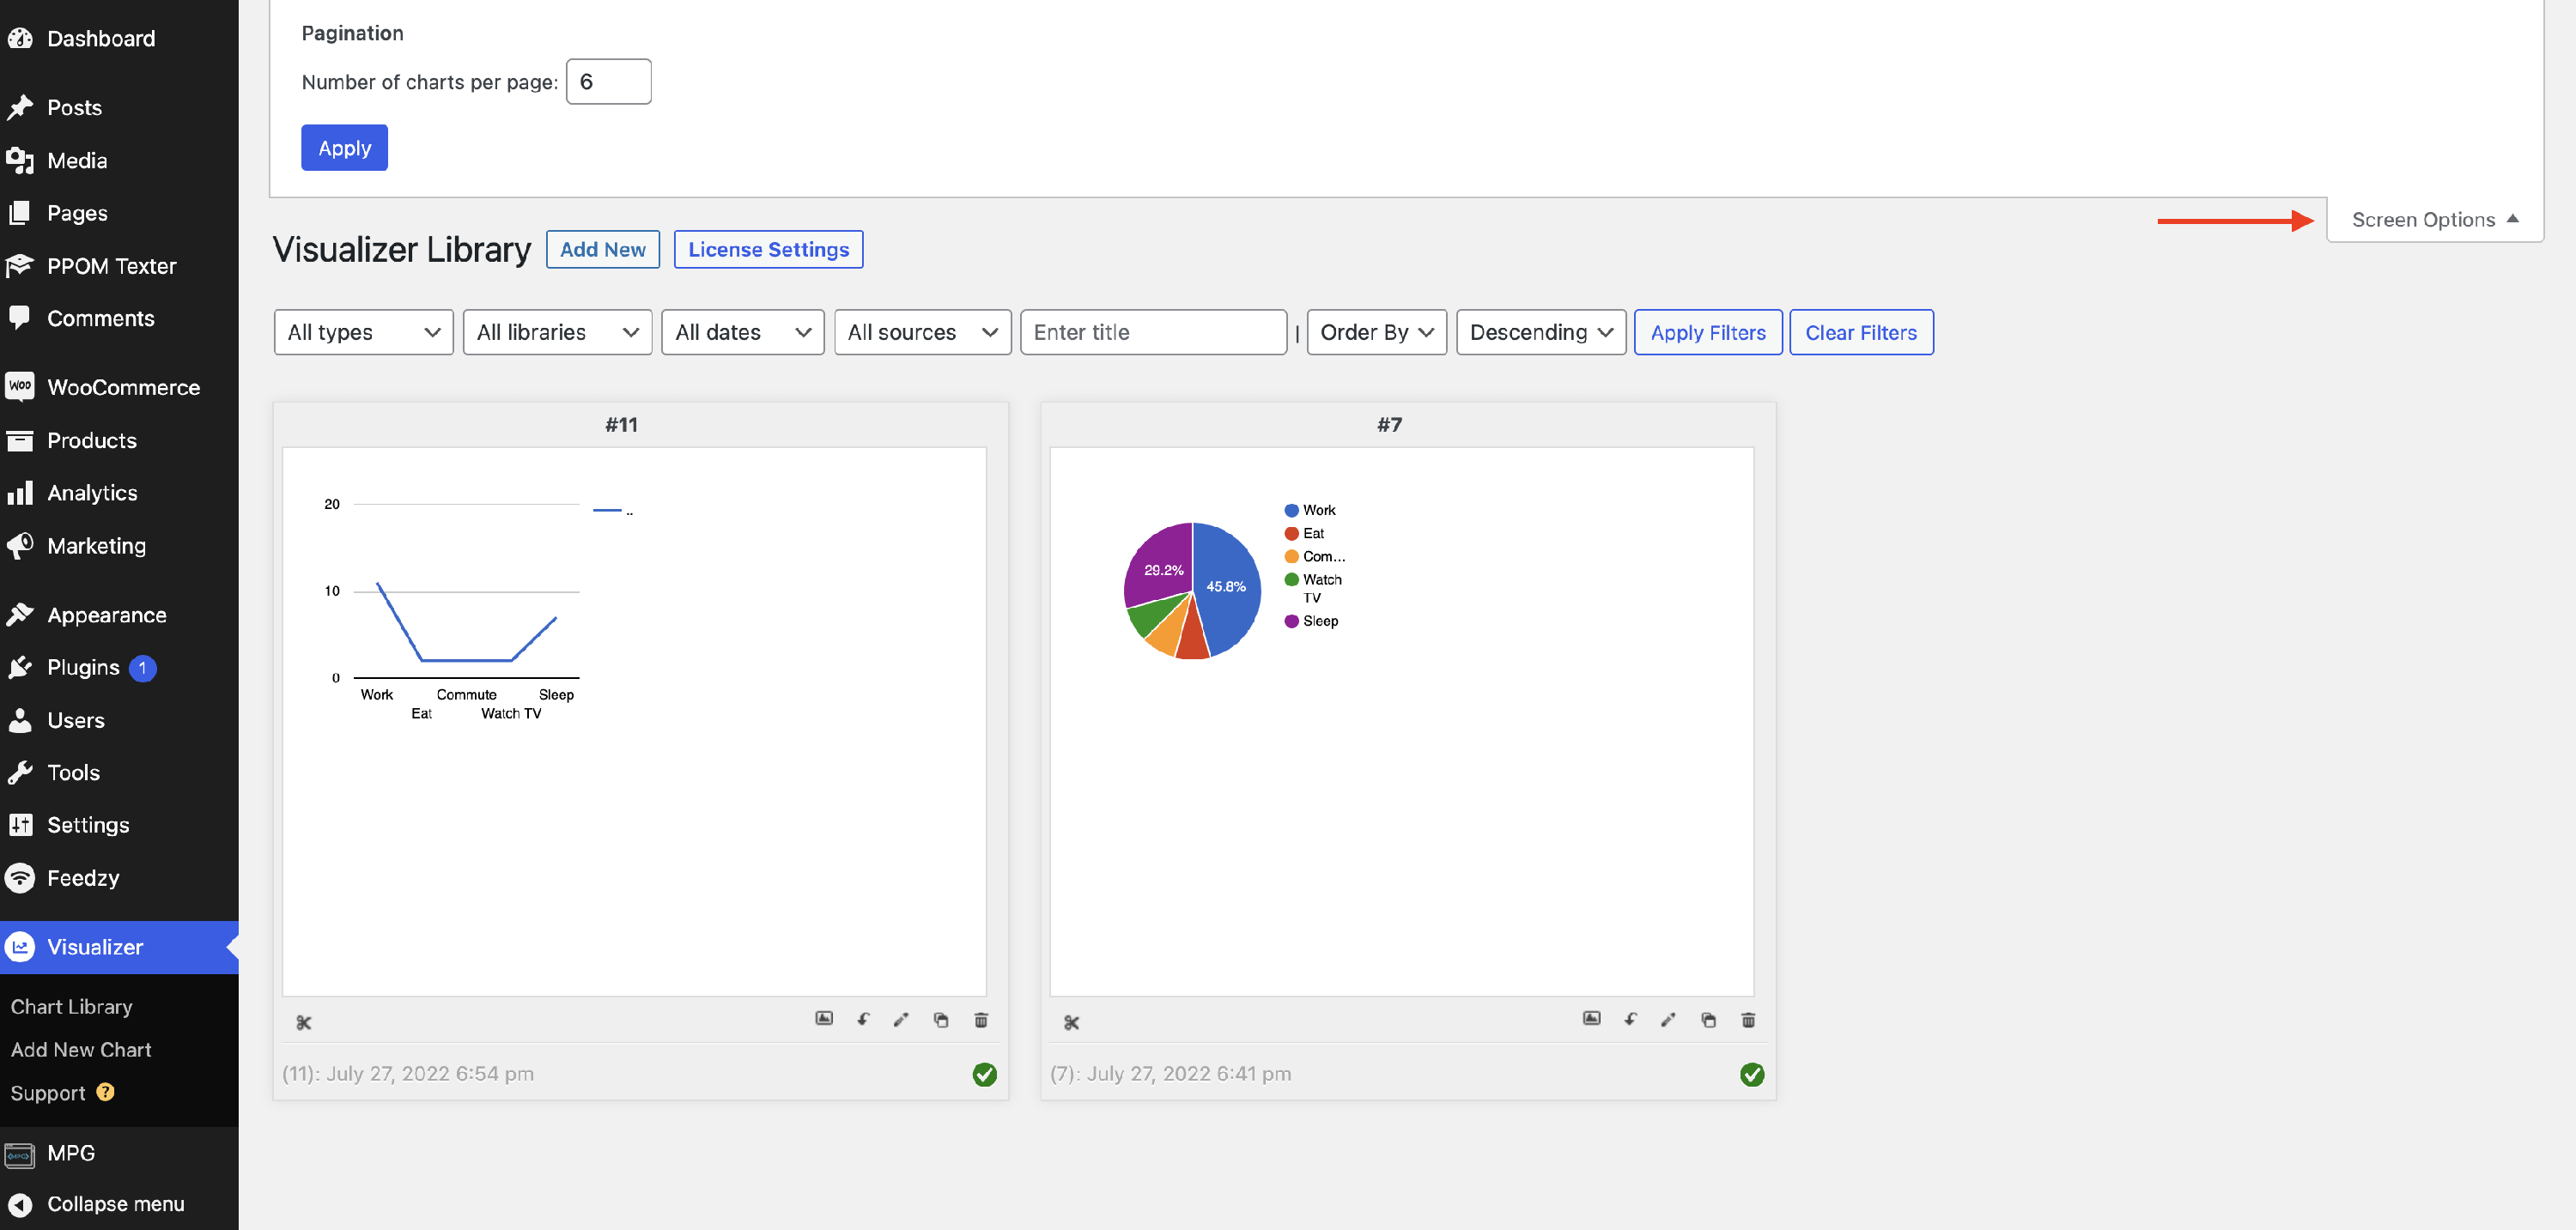
The charts can also be filtered based on type, used library, and creation date:
1. Choose your preferred options.
2. Click on Apply Filters.
📝 Note: To reset the search, just click on Clear Filters.
Translate Visualizer's data
📝 Note: The premium version of Visualizer allows you to make the charts even more accessible through translation options.
Visualizer Pro can render the translated version of your charts and display them once the user clicks on the language switcher.