How can I display a chart?
📝 Note: This feature is part of Visualizer: Charts and Graphs. Take a look at the complete documentation of the plugin here.
There are several ways to display the charts created with Visualizer. If you are using Elementor, see How to display a chart in Elementor for the dedicated widget instructions. The methods below cover the shortcode and Gutenberg block approaches:
Shortcode Block
1. Navigate to Dashboard > Visualizer > Chart Library.
2. Click on the [/] icon to copy the specific shortcode.
Copy shortcode from the Charts Library
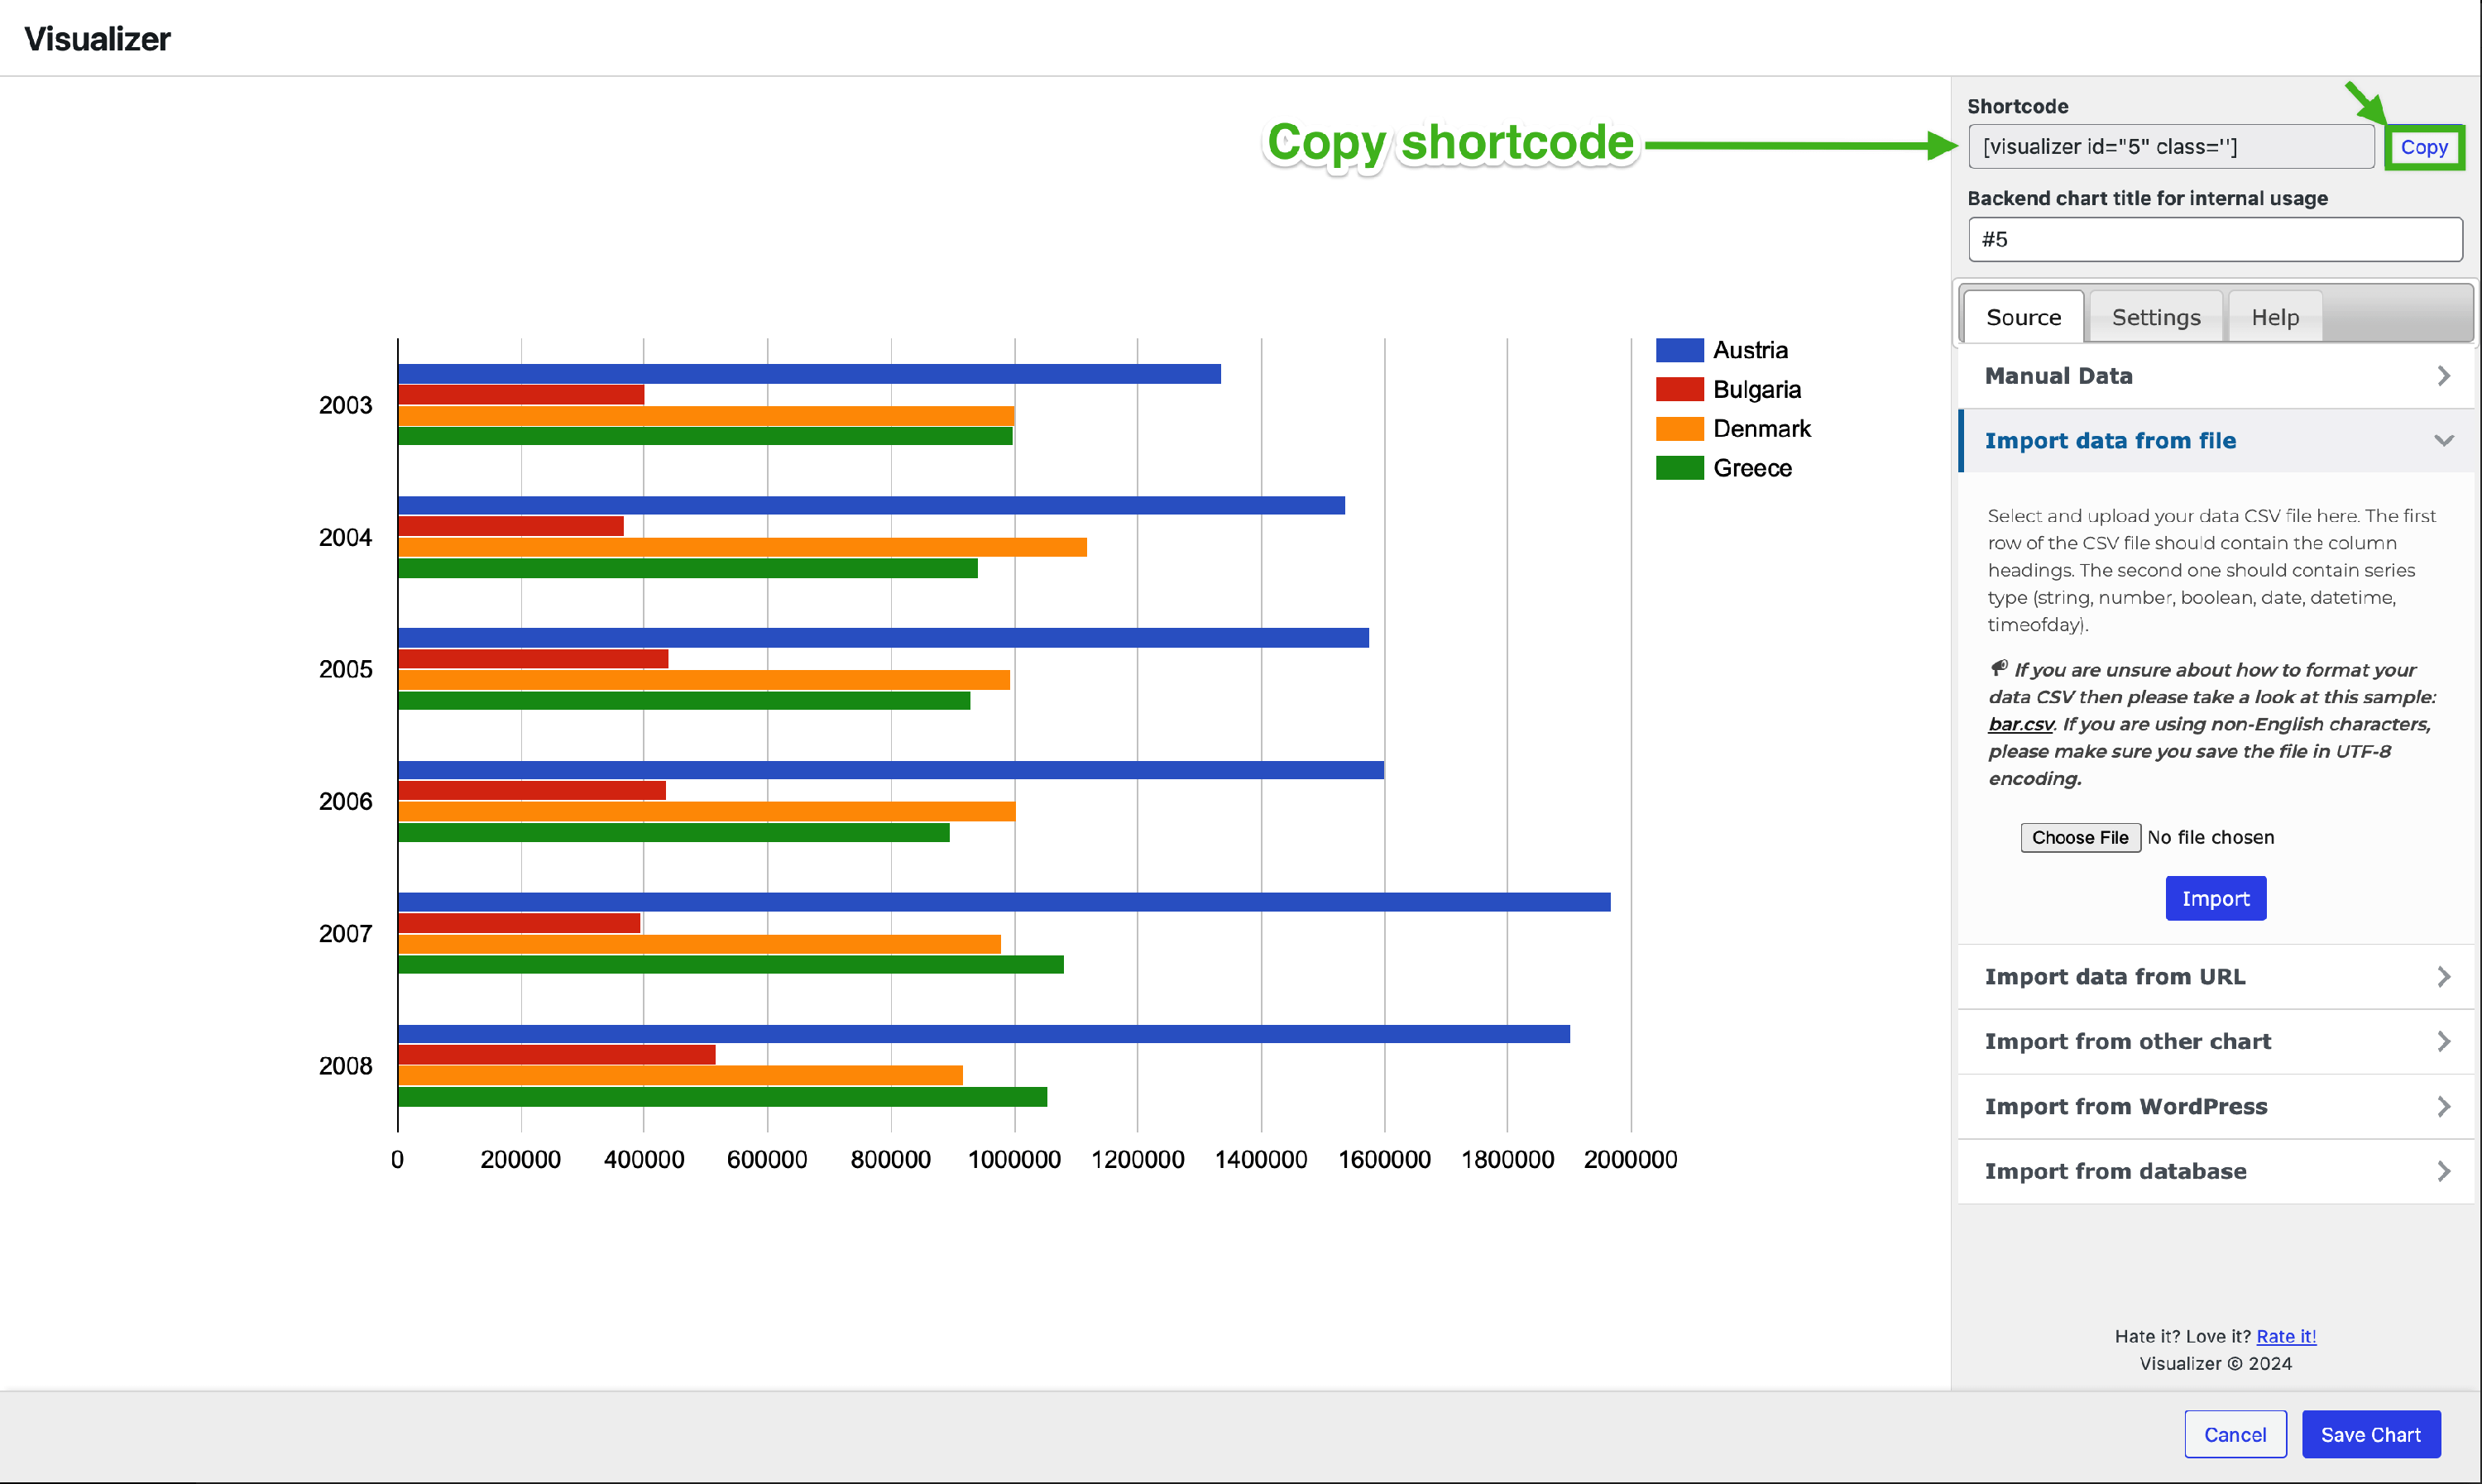
Copy shortcode when editing the chart
3. Choose one of the posts/pages where you want to add a graph/chart.
4. Click on the ➕ button to Add a new block.
5. Type "Shortcode" into the search bar and select the block.
6. Paste the code of the chart that you copied in Step 2.
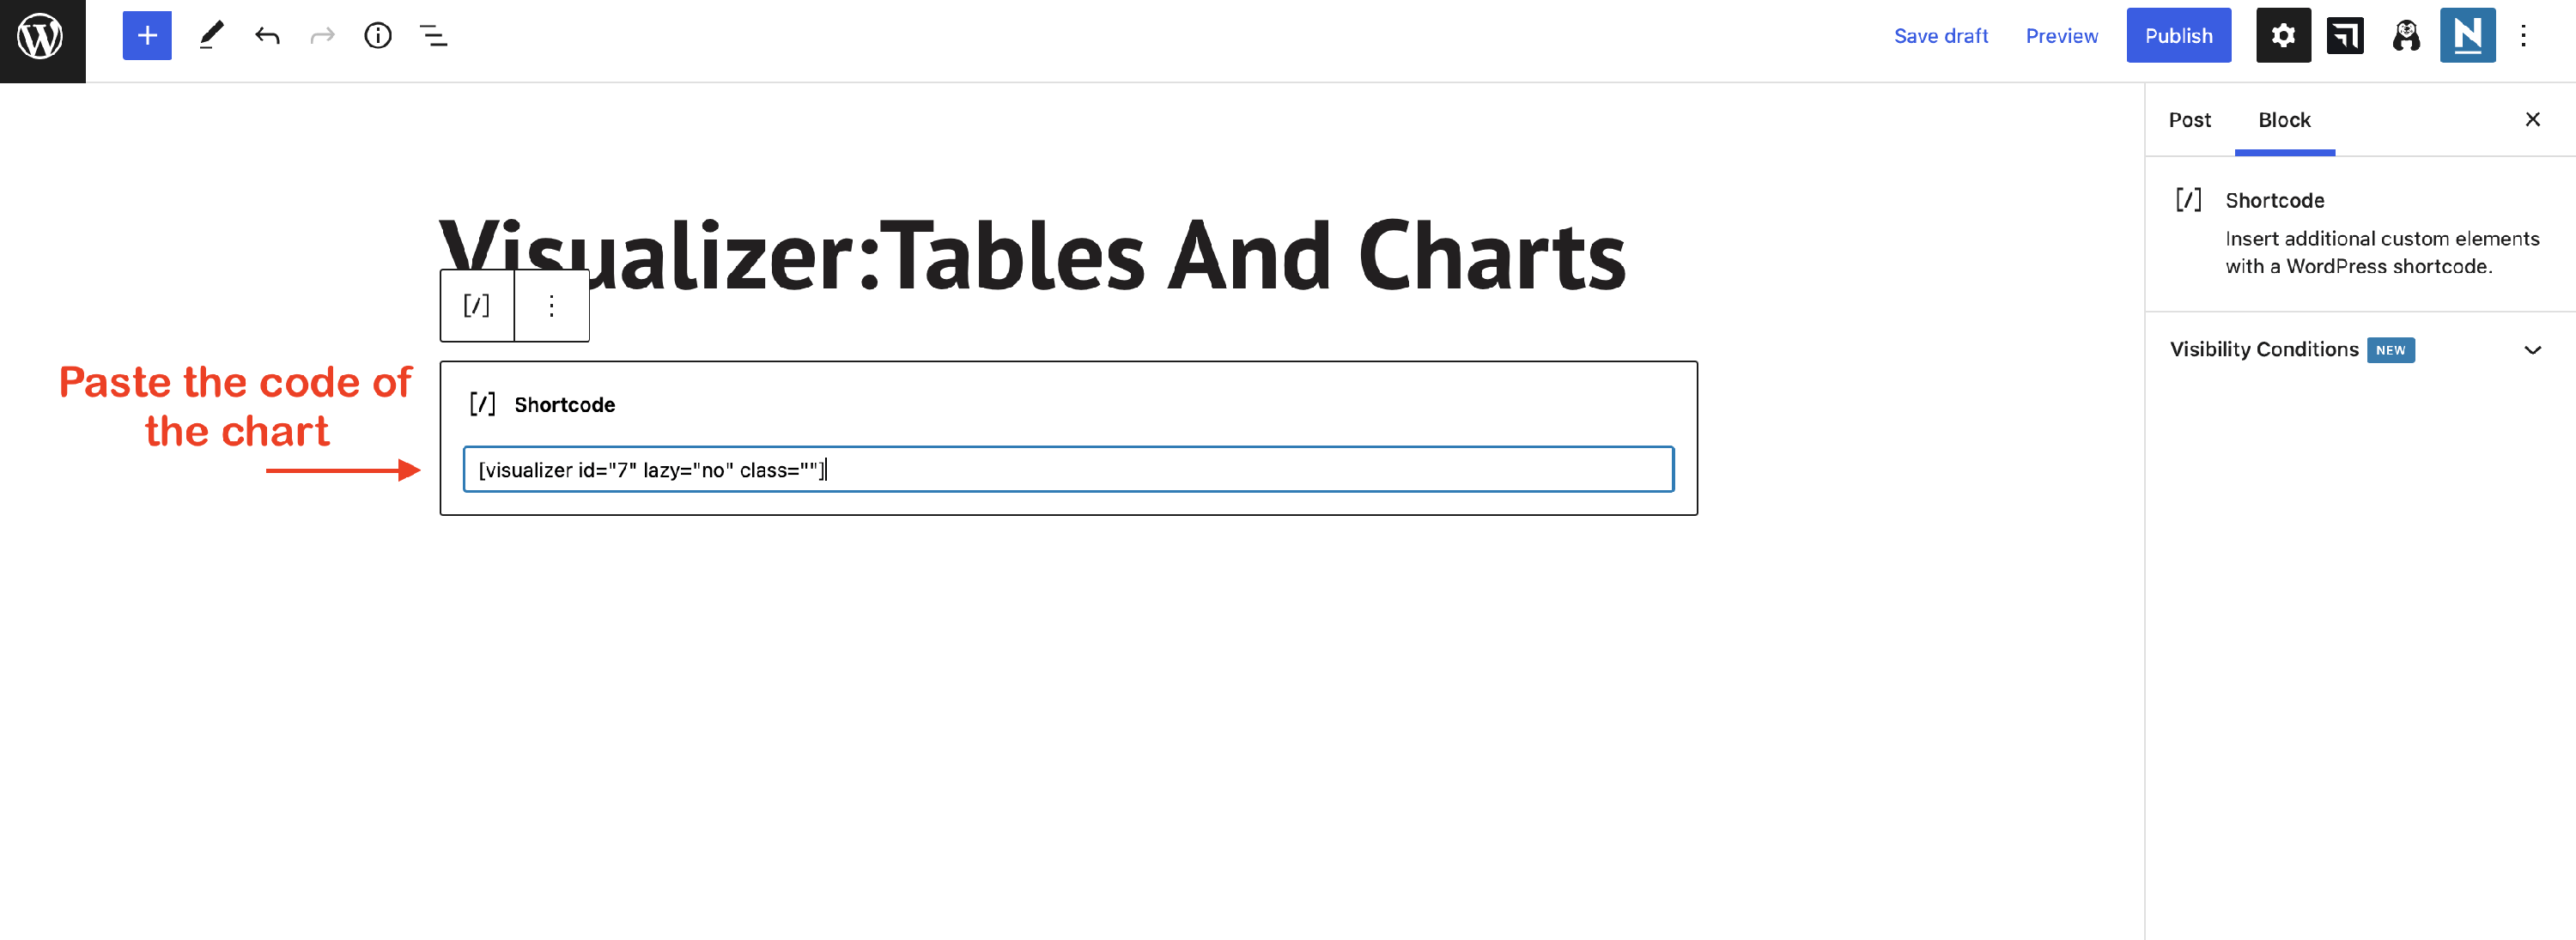
📝 Note: To see the chart, publish the post and check the website.
Using the Visualizer block [Deprecated]
📝 Note: Block editor has been deprecated to simplify the process and keep chart settings in one place, we improved the user experience of block editor via iframe. If you prefer to keep the block editor, you can add this custom code to your website to add it back:add_filter( 'visualizer_legacy_block_edit', '__return_true' );
Please keep in mind that we do not plan any further updates or maintenance for the block editor.
1. Navigate to the desired Page / Post where you want to add the chart / graph.
2. Click on the ➕ button to Add a new block.
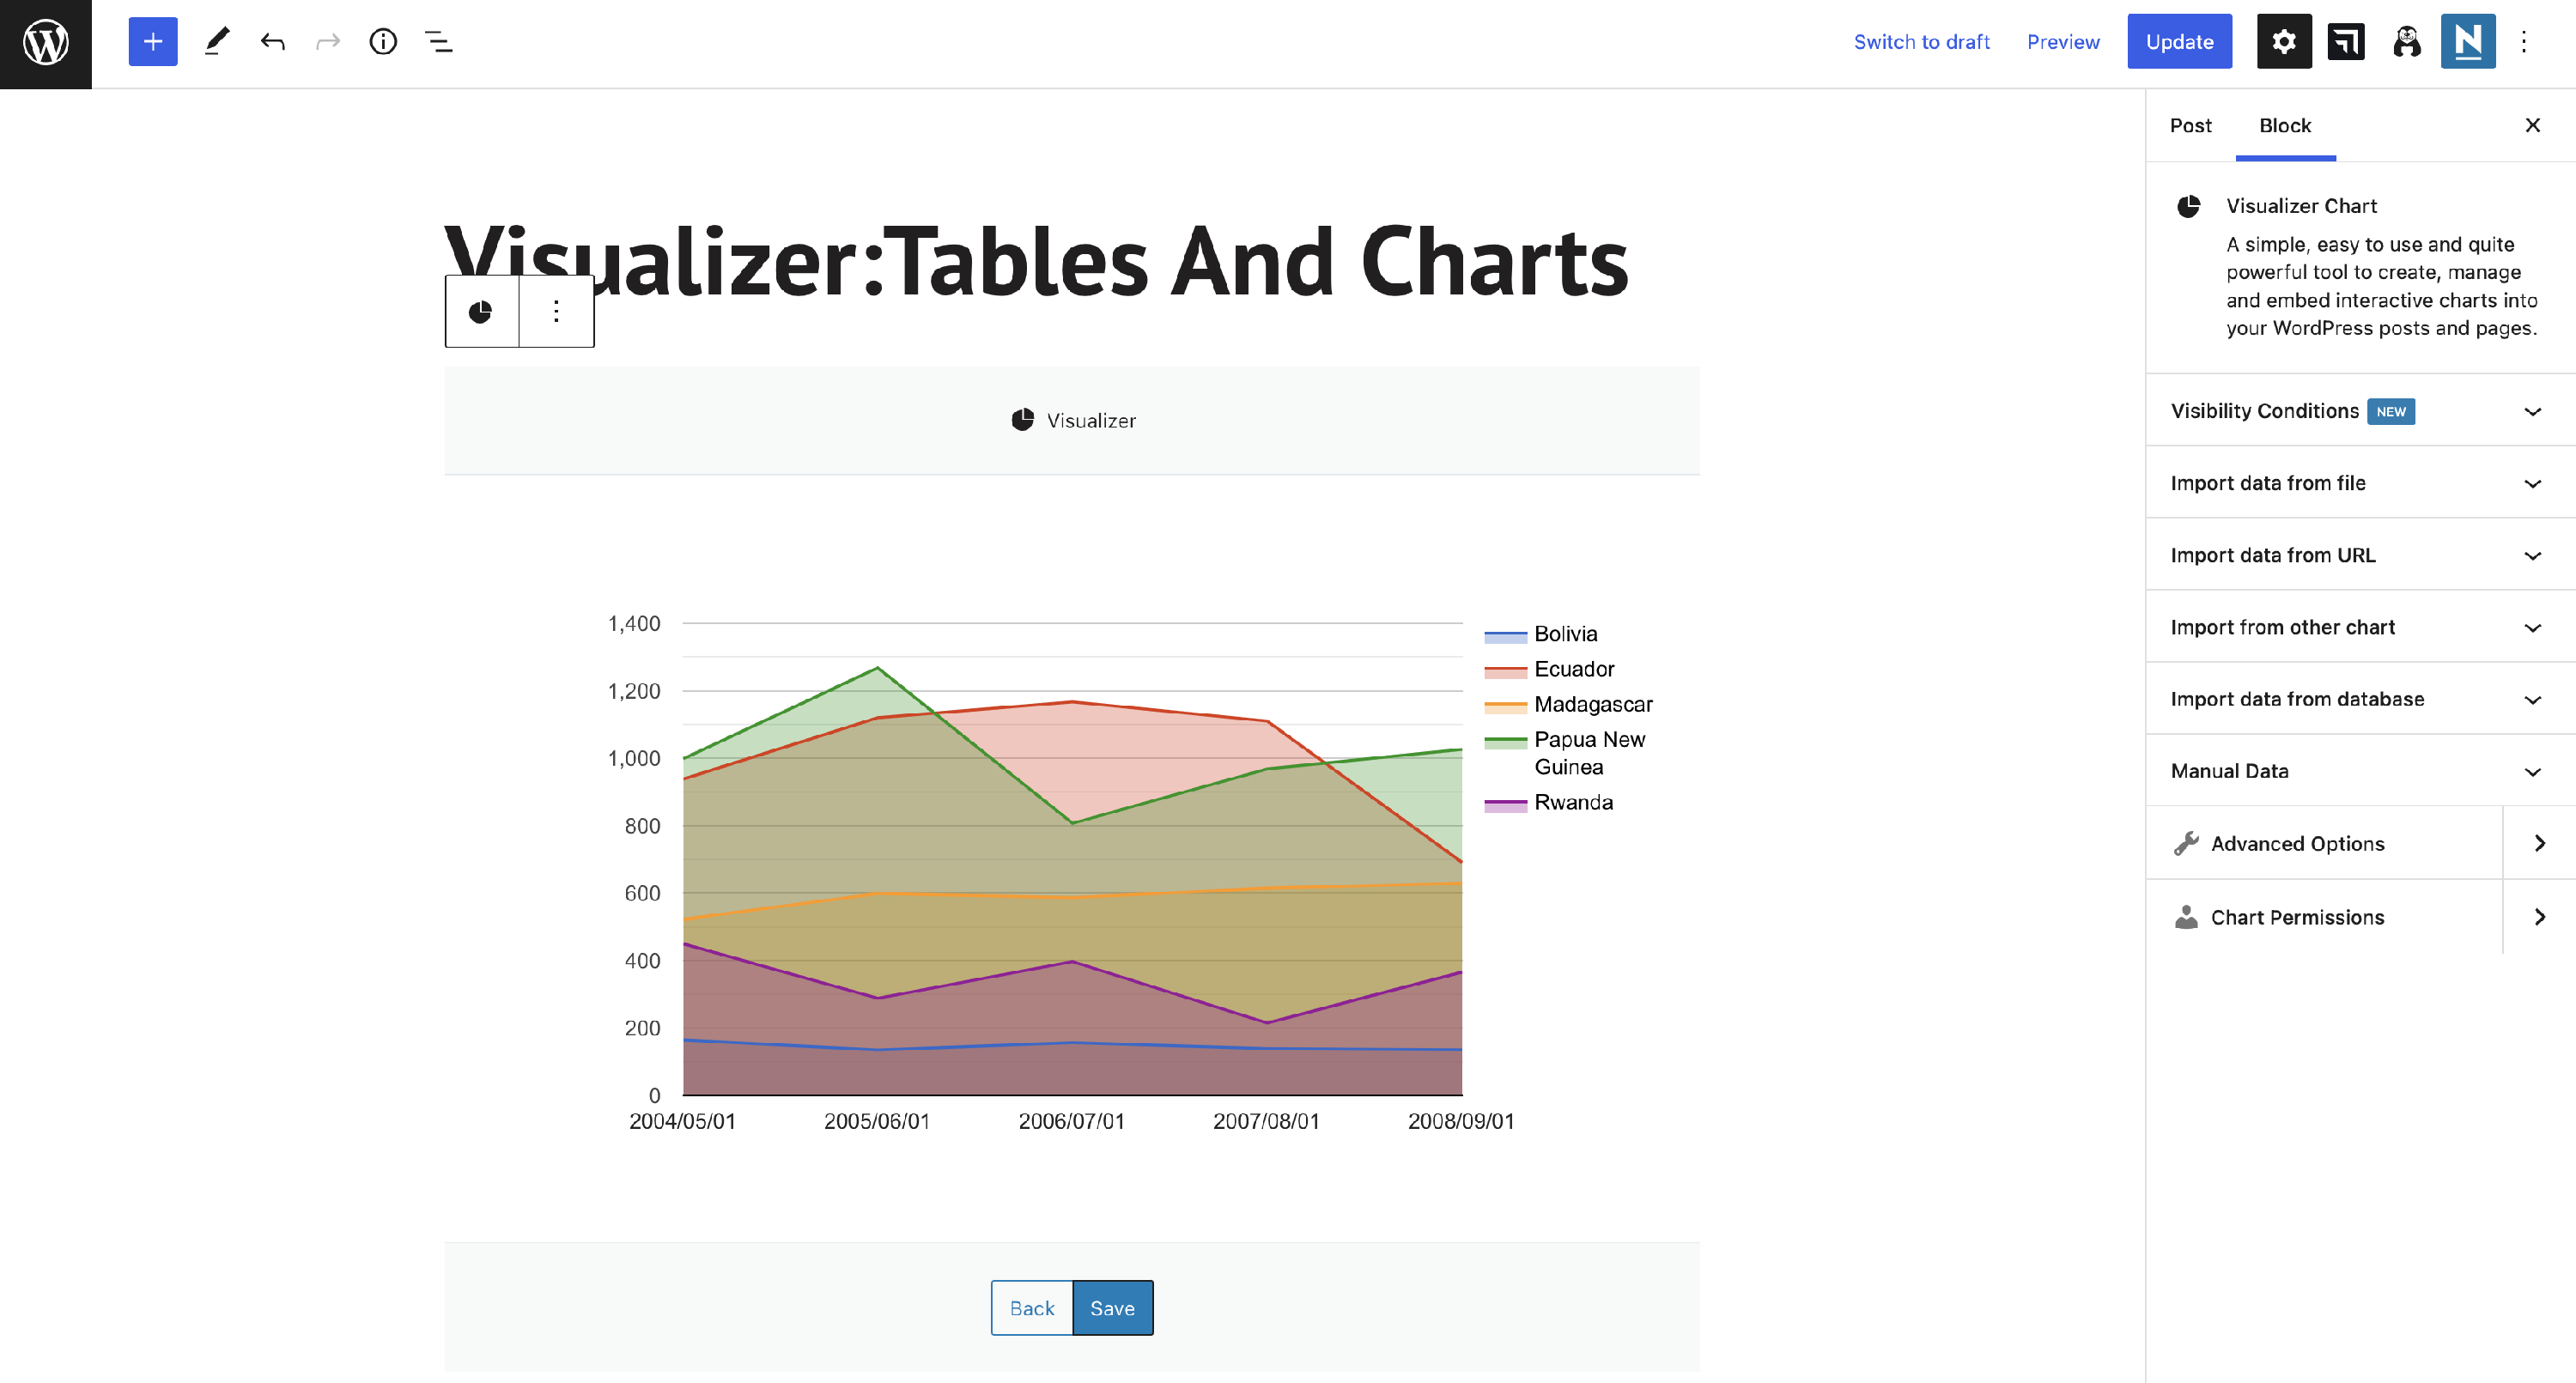
3. Type " Visualizer Chart" into the search bar.
4. Click on the Display an existing chart option.
5. Choose one of the charts from the library.
📝 Note: On AMP, an extra feature renders the chart as an image. This way, switching devices will not affect the charts' mobile display.