Free Charts Library
📝 Note: These are part of Visualizer: Charts and Graphs. Take a look at the complete documentation of the plugin here.
Visualizer offers four charts in the free version, some of the most usual ones, to help you manage your data.
- Table Chart - organizes information according to the rows and columns.

📌 Here is a dedicated documentation about the Table Chart.
- Pie / Donut Chart - shows the relational proportions between data.
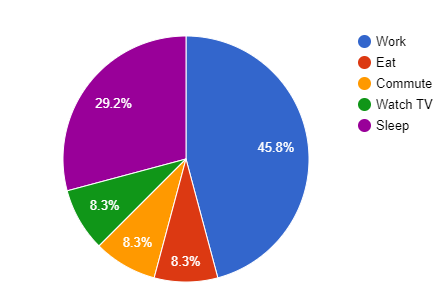
📌 GoogleChart: Here is a dedicated documentation about the Pie / Donut Chart.
- Line Chart - very useful when it comes to determining how statistics vary from month to month.
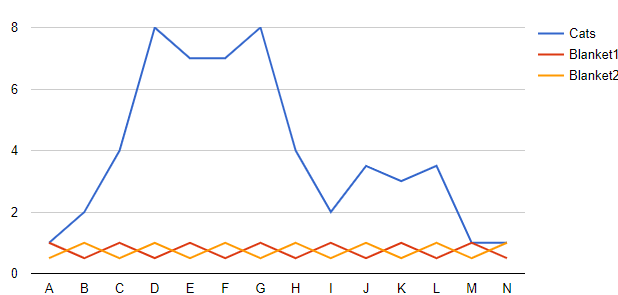
📌 GoogleChart: Here is a dedicated documentation about the Line Chart.
- Bar Chart - used to show the comparison of multiple data sets side by side.
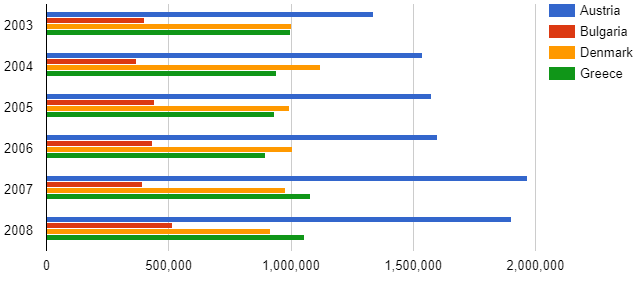
📌 GoogleChart: Here is a dedicated documentation about the Bar Chart.
📝 Note: The free version does not offer the ChartJS rendering engine. You can find it in the PRO version.