How can I create a chart?
A chart can be created from the post editor and the charts library. The process of chart creation from both places is similar.
📝 Note: Before creating the chart, please note that by default, the plugin saves an image of the chart in your Media Library. The purpose of this is to be available for download in case you enable it in the front-end actions and for rendering the chart as an image on the AMP version of the page, which is done automatically. To prevent creating a copy of the chart as an image in your media library, just uncheck this box in the chart settings (click for image). Please note that if AMP is enabled on your website, this option is automatically turned on.
In this article, you will find describe each of the scenarios:
📖 Page Editor
1. From the block editor, click on the ➕ button to Add a new block. 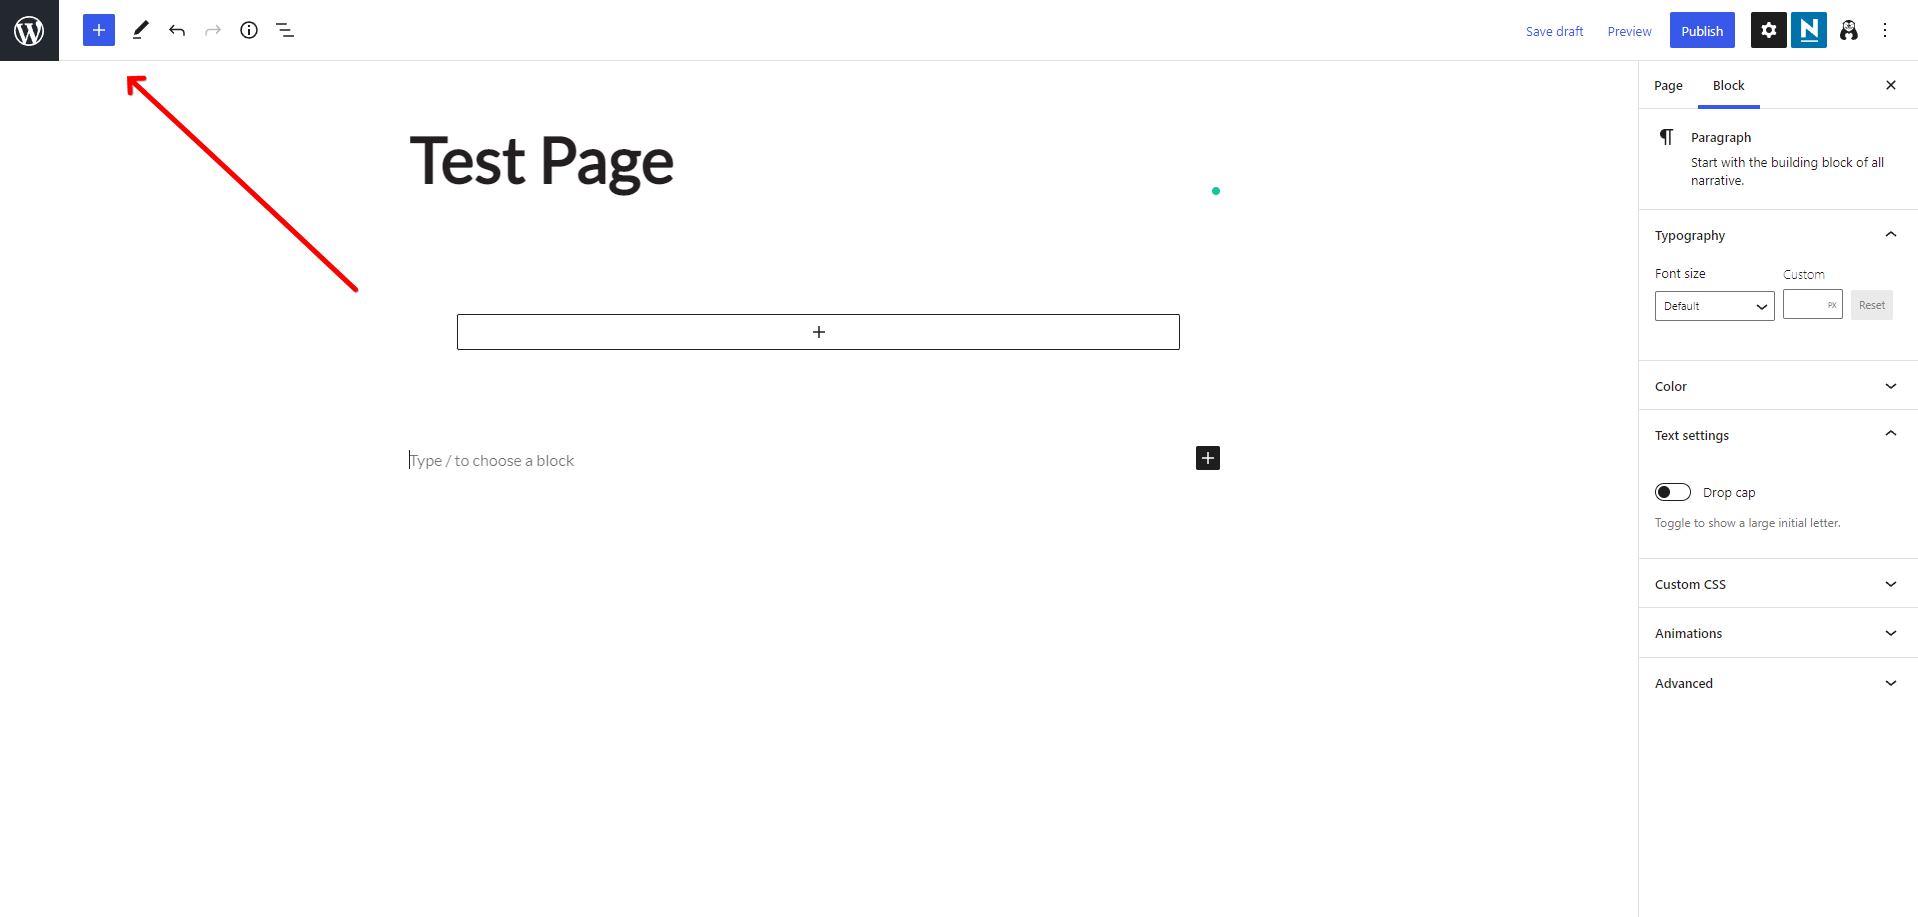
2. Type " Visualizer Chart" into the search bar, and click on the specific icon. 
3. When the block appears, you have two options: to display an existing chart or to create a new one ( we'll focus on this one ). 
4. You have been redirected to the Visualizer menu, and click on Add New. 
5. Choose a library and a chart type. When you're done, click on Next. 
6. You can make the final adjustments to your chart before inserting it. You'll find the setup chart options to the right. 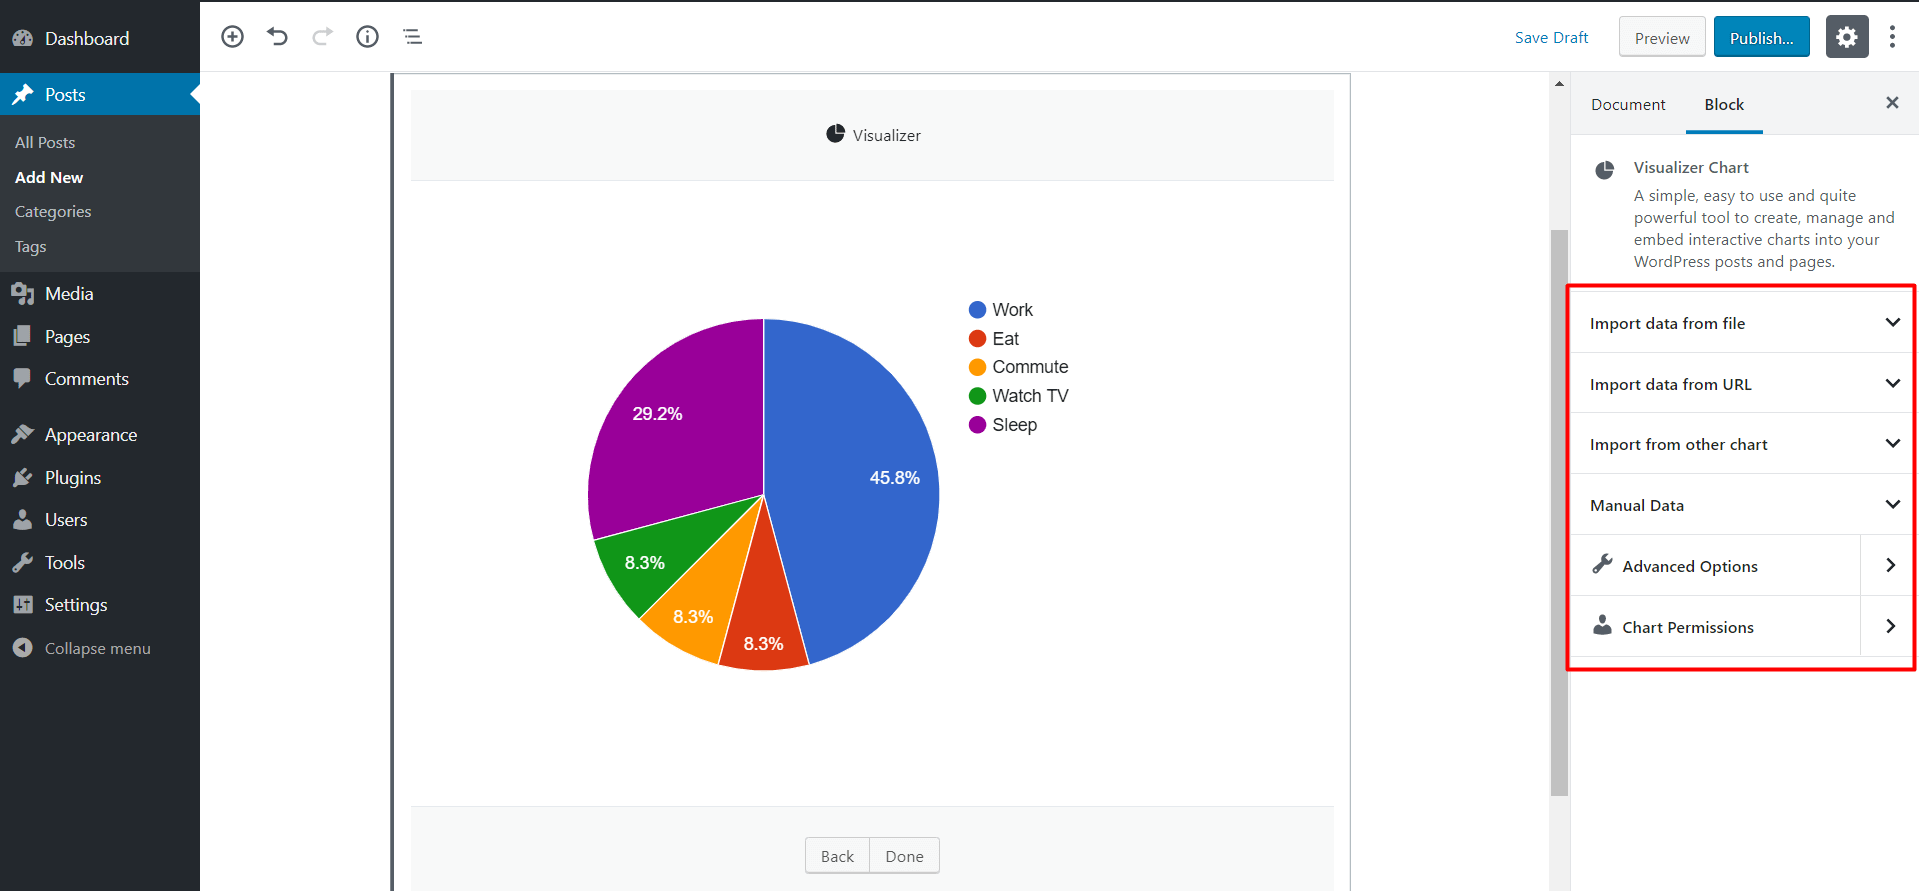
7. When everything is set, click on Create, and the chart will be inserted into the Library. 
📁 Visualizer Library
1. Navigate to Dashboard > Visualizer > Chart Library. 
2. Click on Add new. 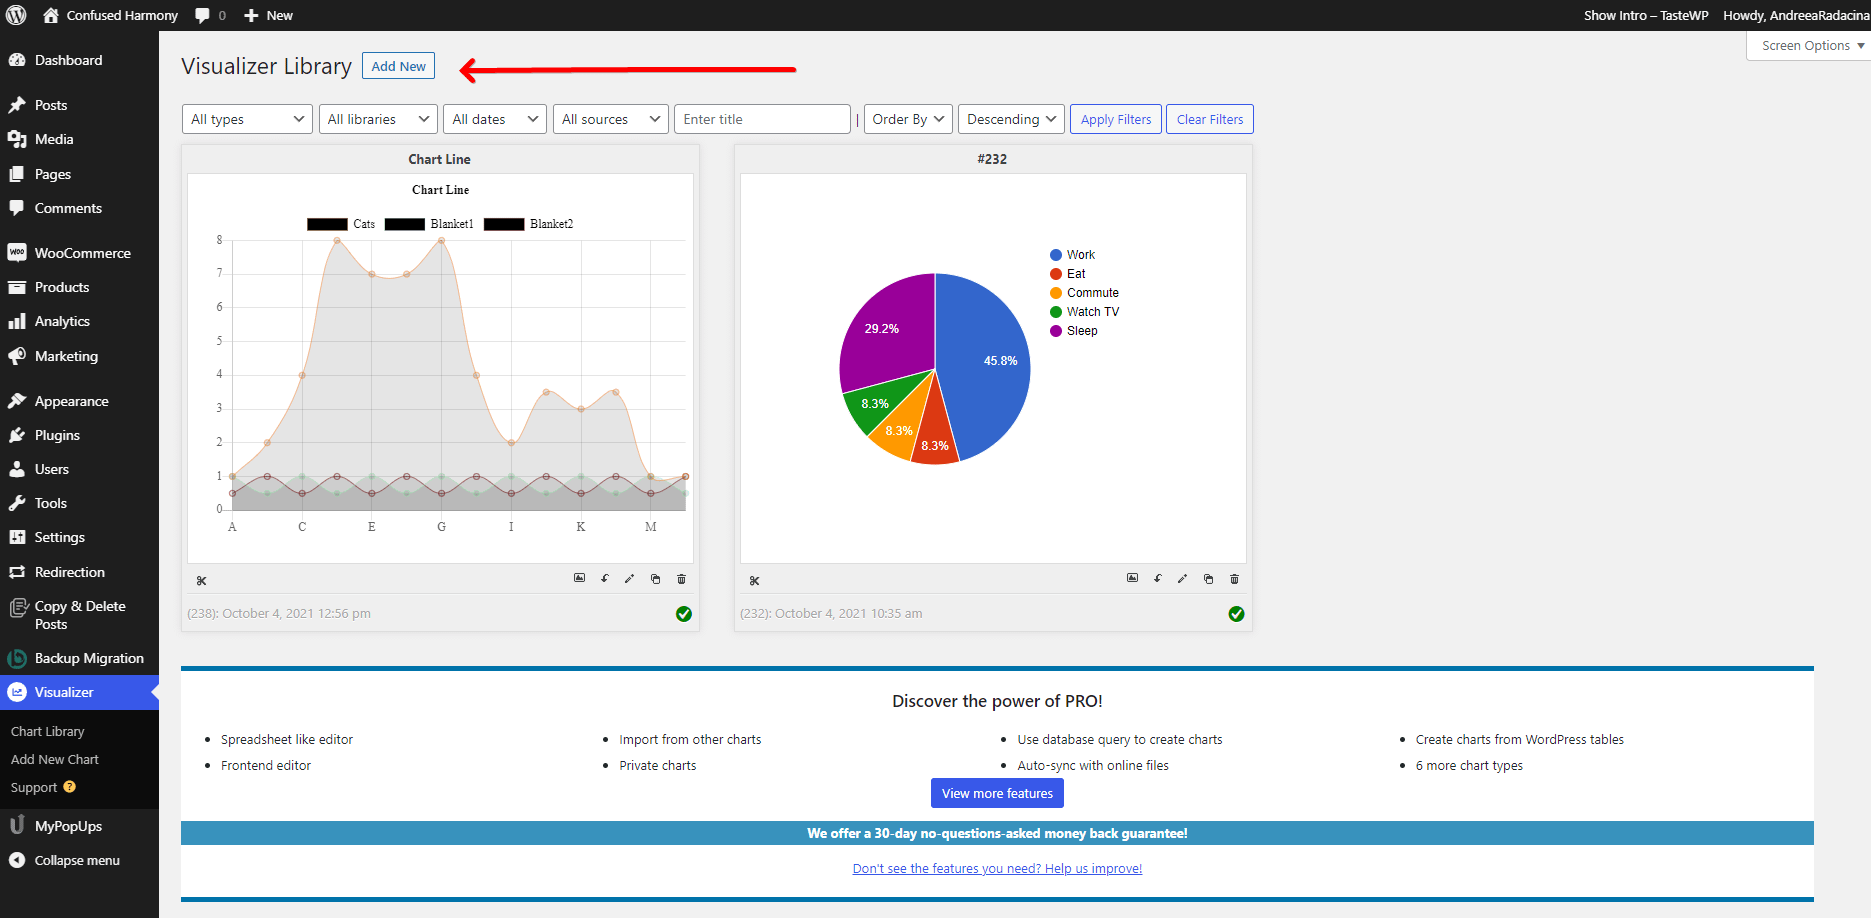
3. From this moment, follow the steps described above in order to create a new chart:
- choose a library and a chart type.
- make some adjustments to the chart.
- when you're done, click on Create.
4. The chart is now in the Visualizer Library. Click to copy the shortcode. 
5. Choose the page where you want to add the chart and navigate to the page editor:
- click on the ➕ button to add a new block.
- search for the Shortcode block and add it to the page.
- paste the shortcode of the chart ( Step 4).
📝 Note: The settings are different for every distinct chart and for every library: DataTable, GoogleCharts, Charts.js (eg. the settings from Table - GoogleCharts are not the same as the settings from Table - DataTable).
That's it! Navigate to the website to see the changes.