How to display WooCommerce Data Charts using Visualizer?
📝 Note: This feature is part of Visualizer PRO, which you can get from here.
If you're the admin of an online shop, probably you sometimes feel the need to create reports with the statistics that WooCommerce provides, and now you can do this using the Visualizer: Charts and Graphs plugin.
🧰 Using the Feature
1. Navigate to Visualizer > Chart Library and open one of the charts.
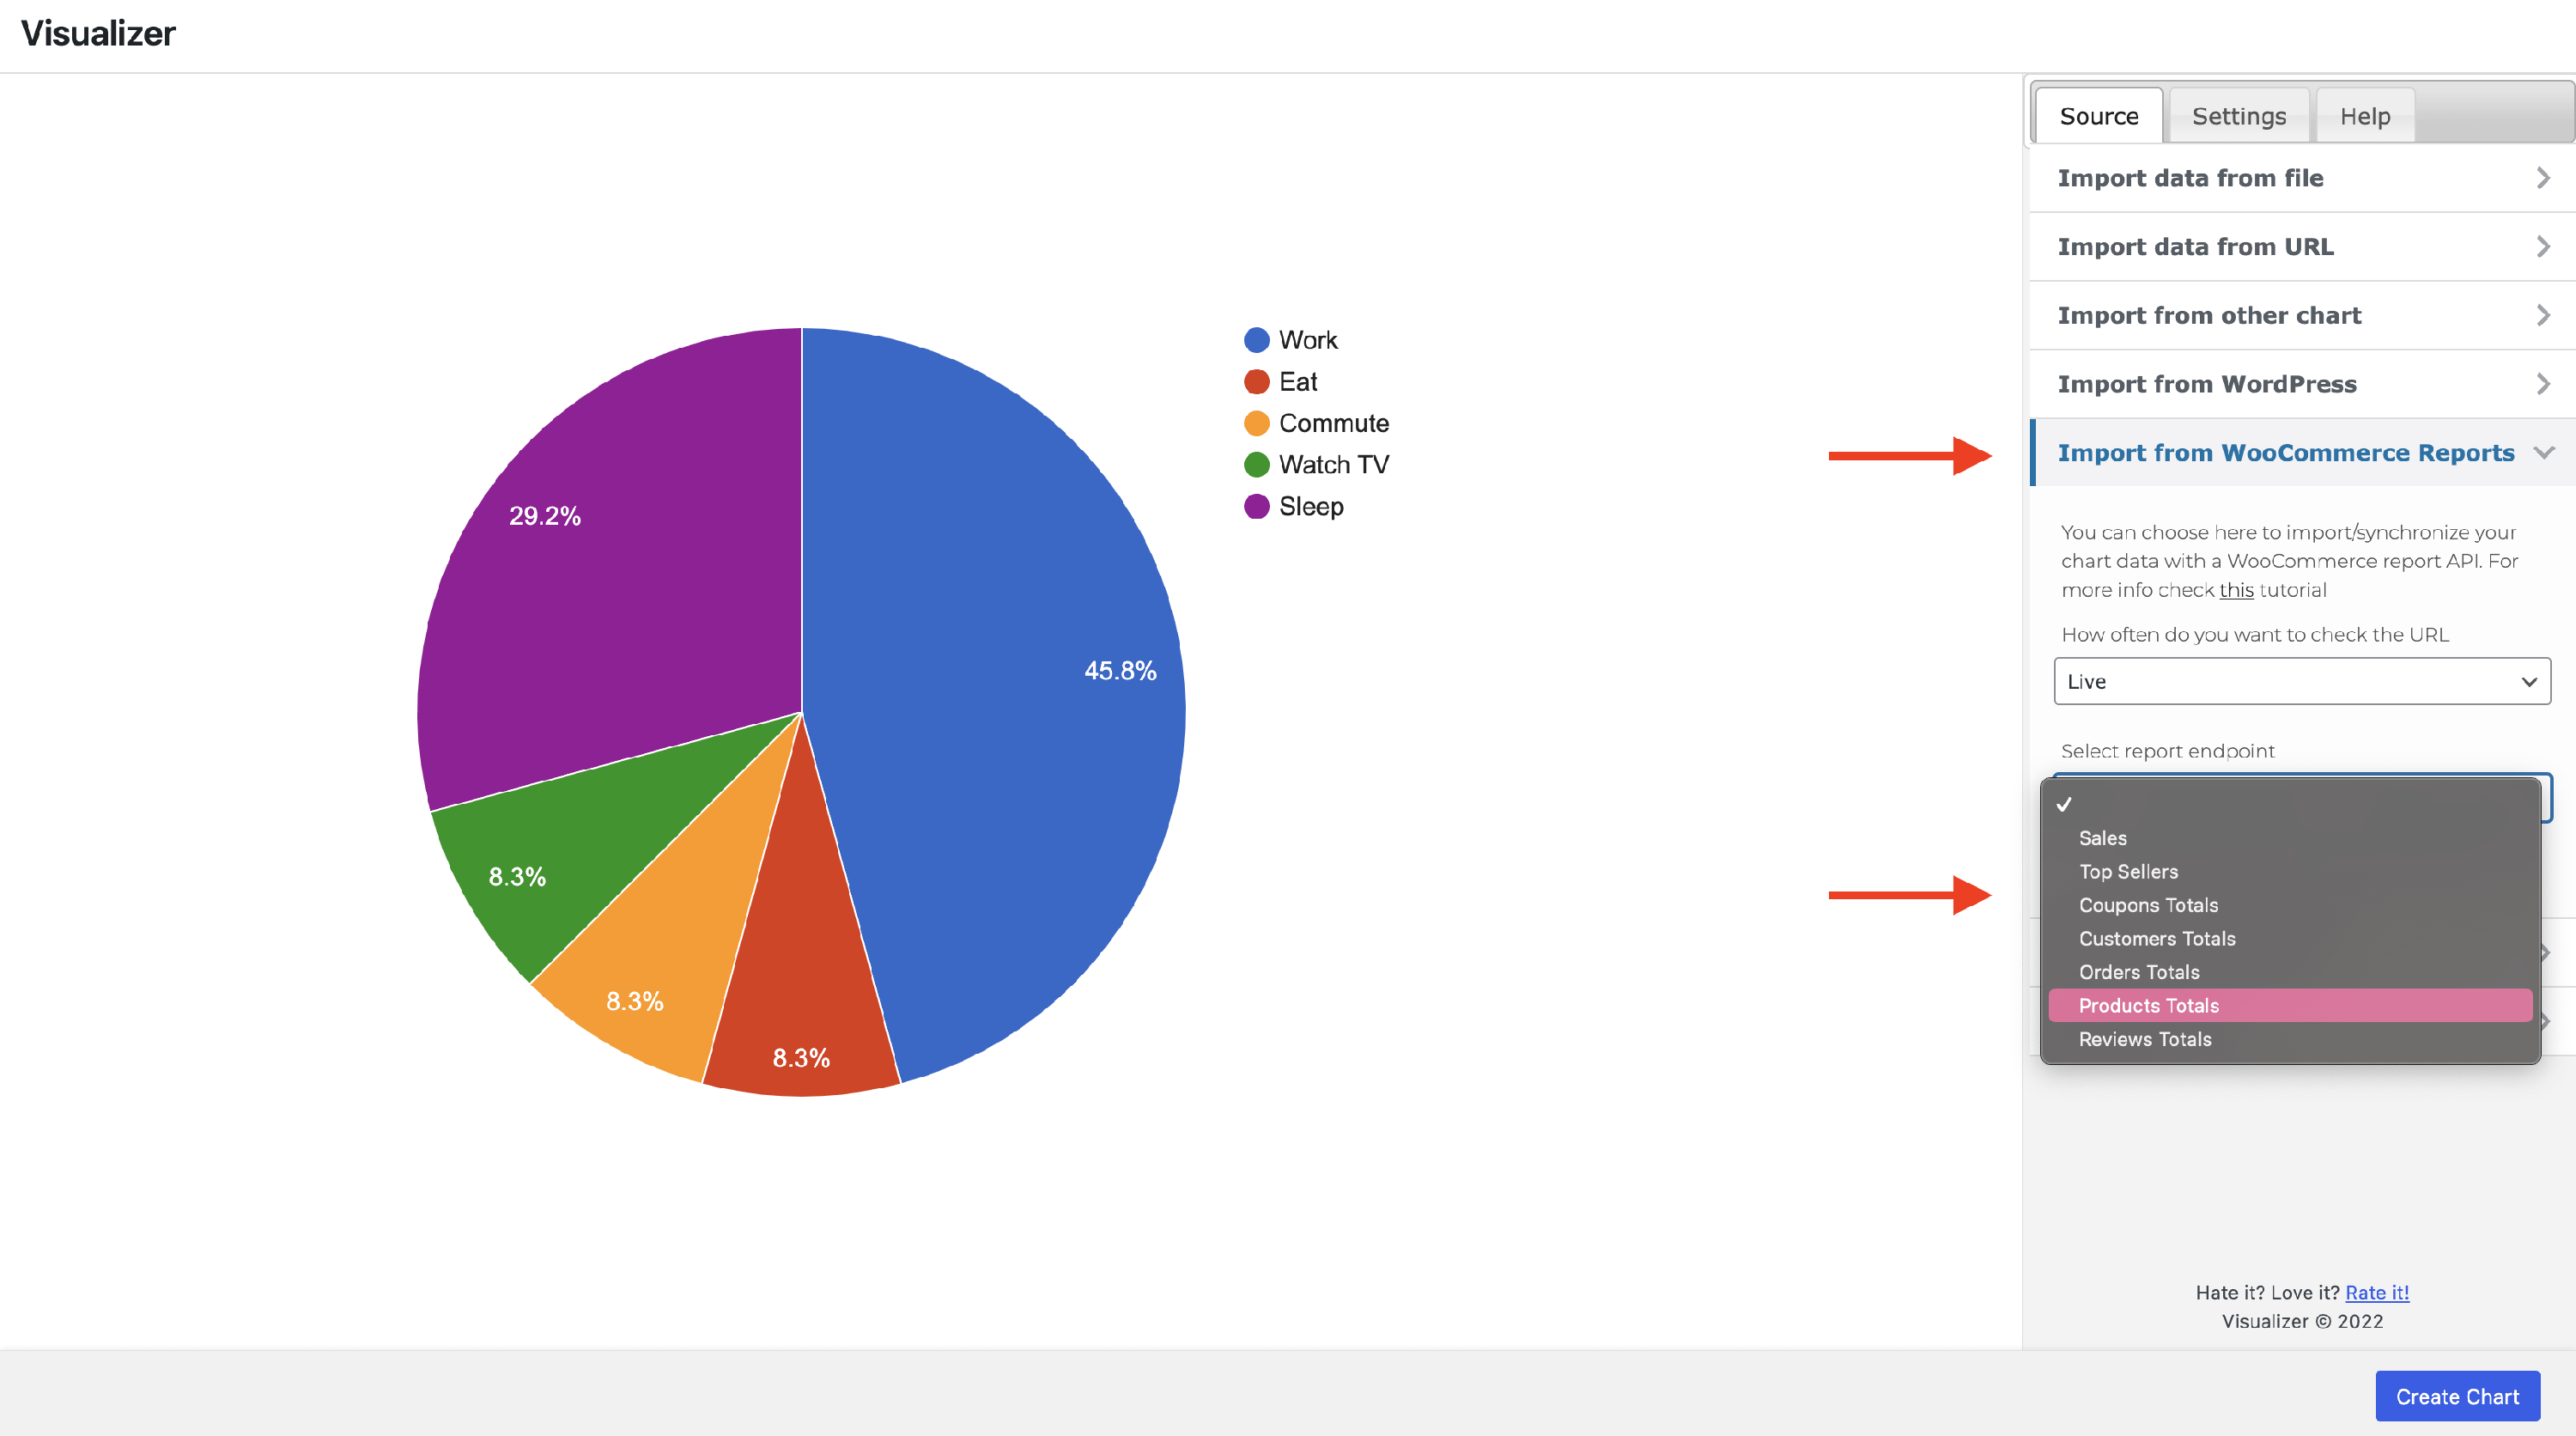
2. Under the Source tab, open the Import from WooCommerce Reports option.
3. From there, you can create a schedule for caching the data and one of the available statistics.
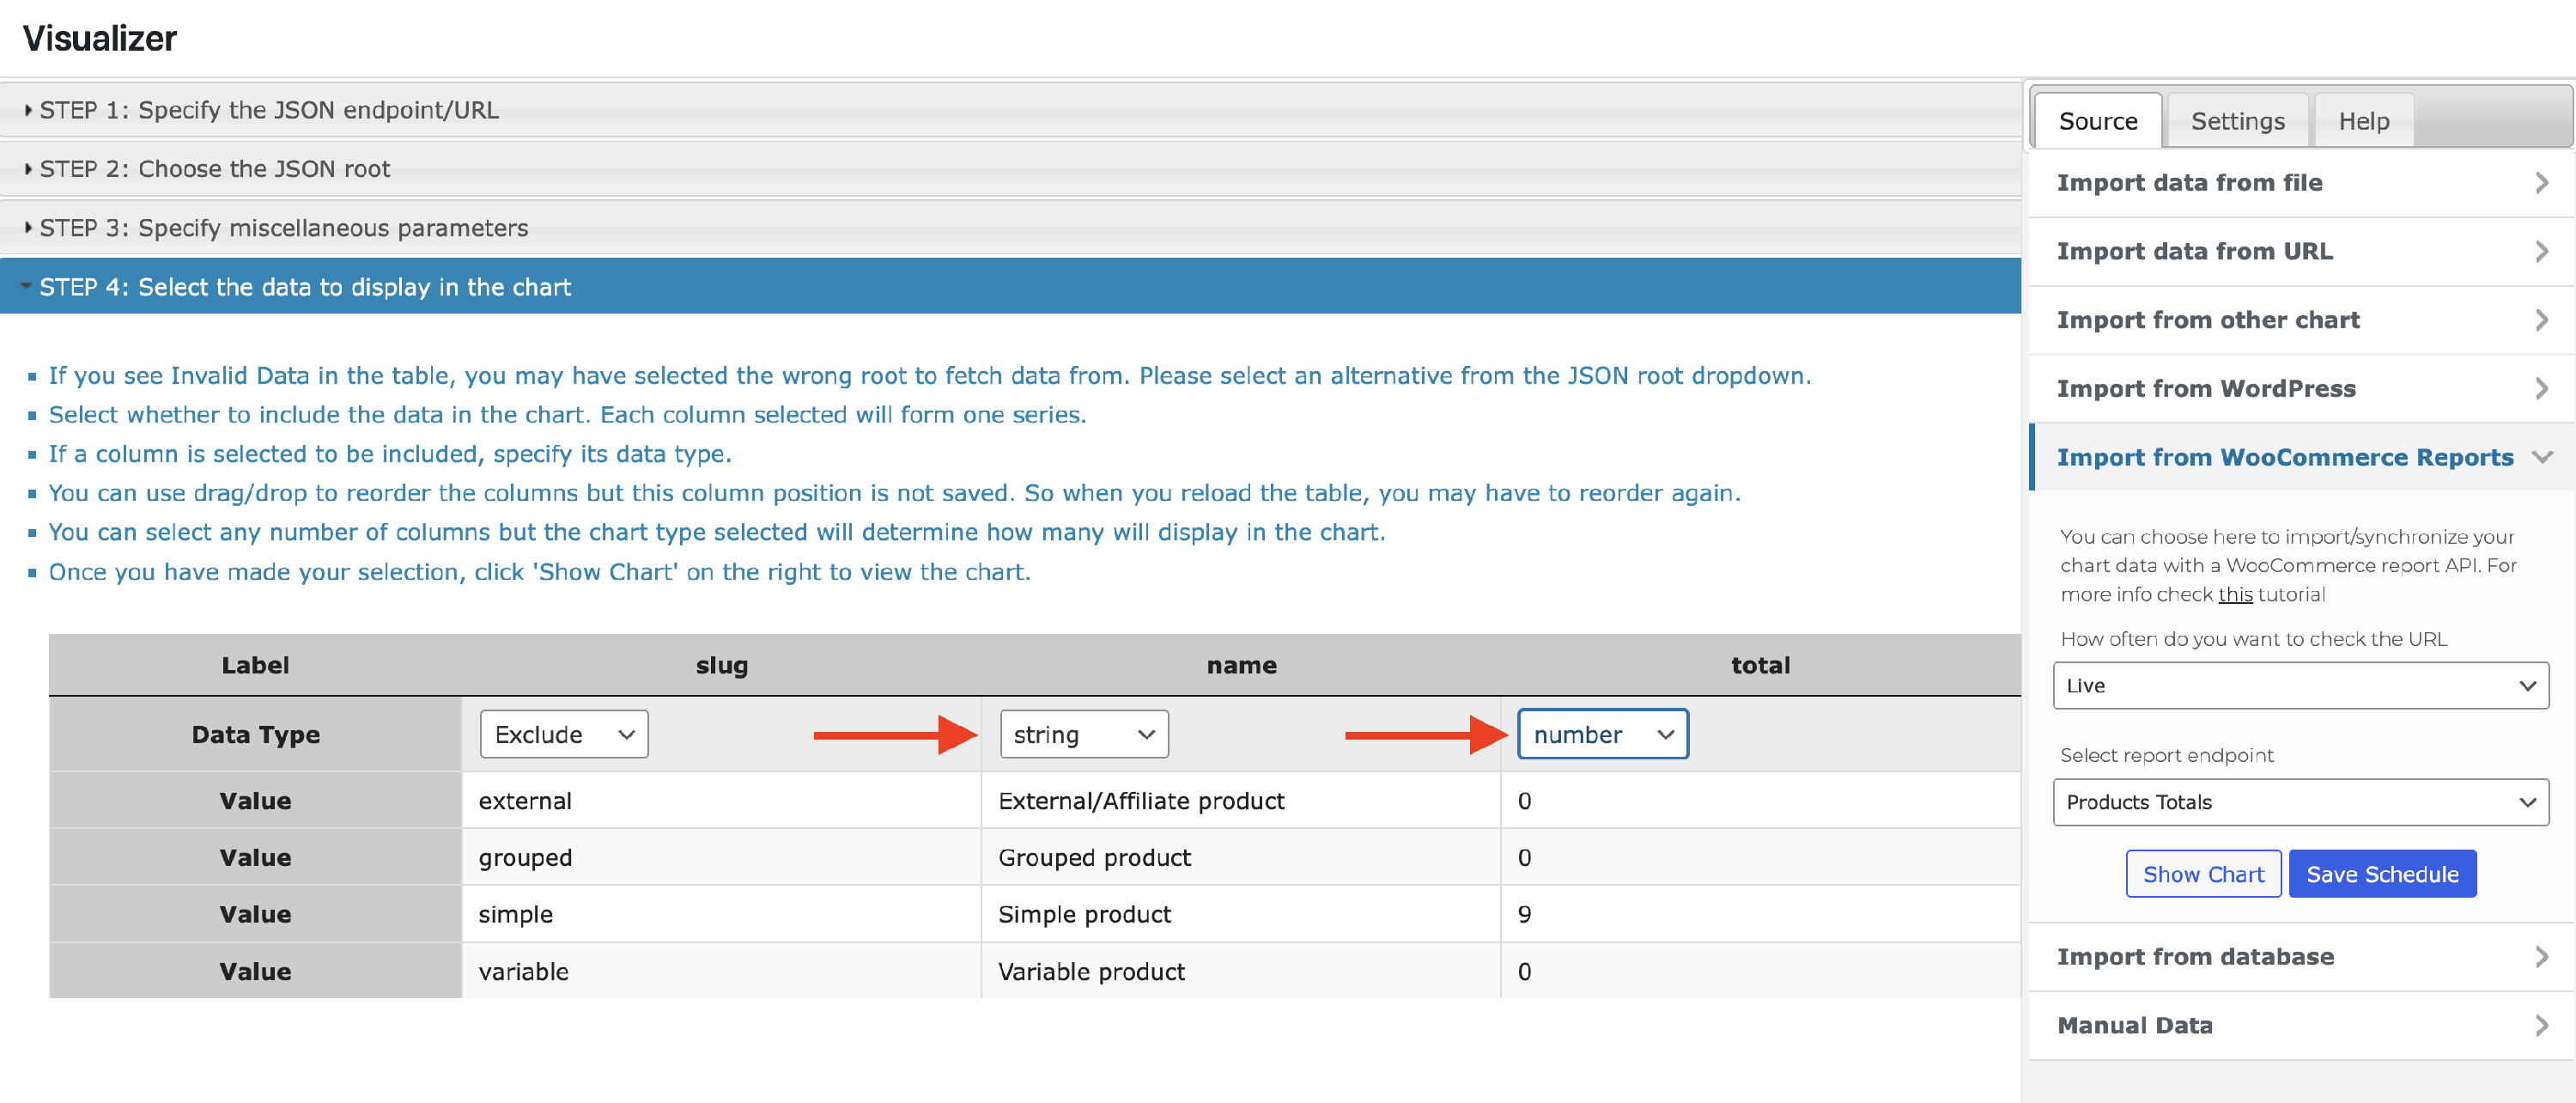
After clicking on the Create Parameters button, 4 steps will appear on the left side to configure the chart. In the last step, you can select which columns you want to provide in your chart by specifying a data type:
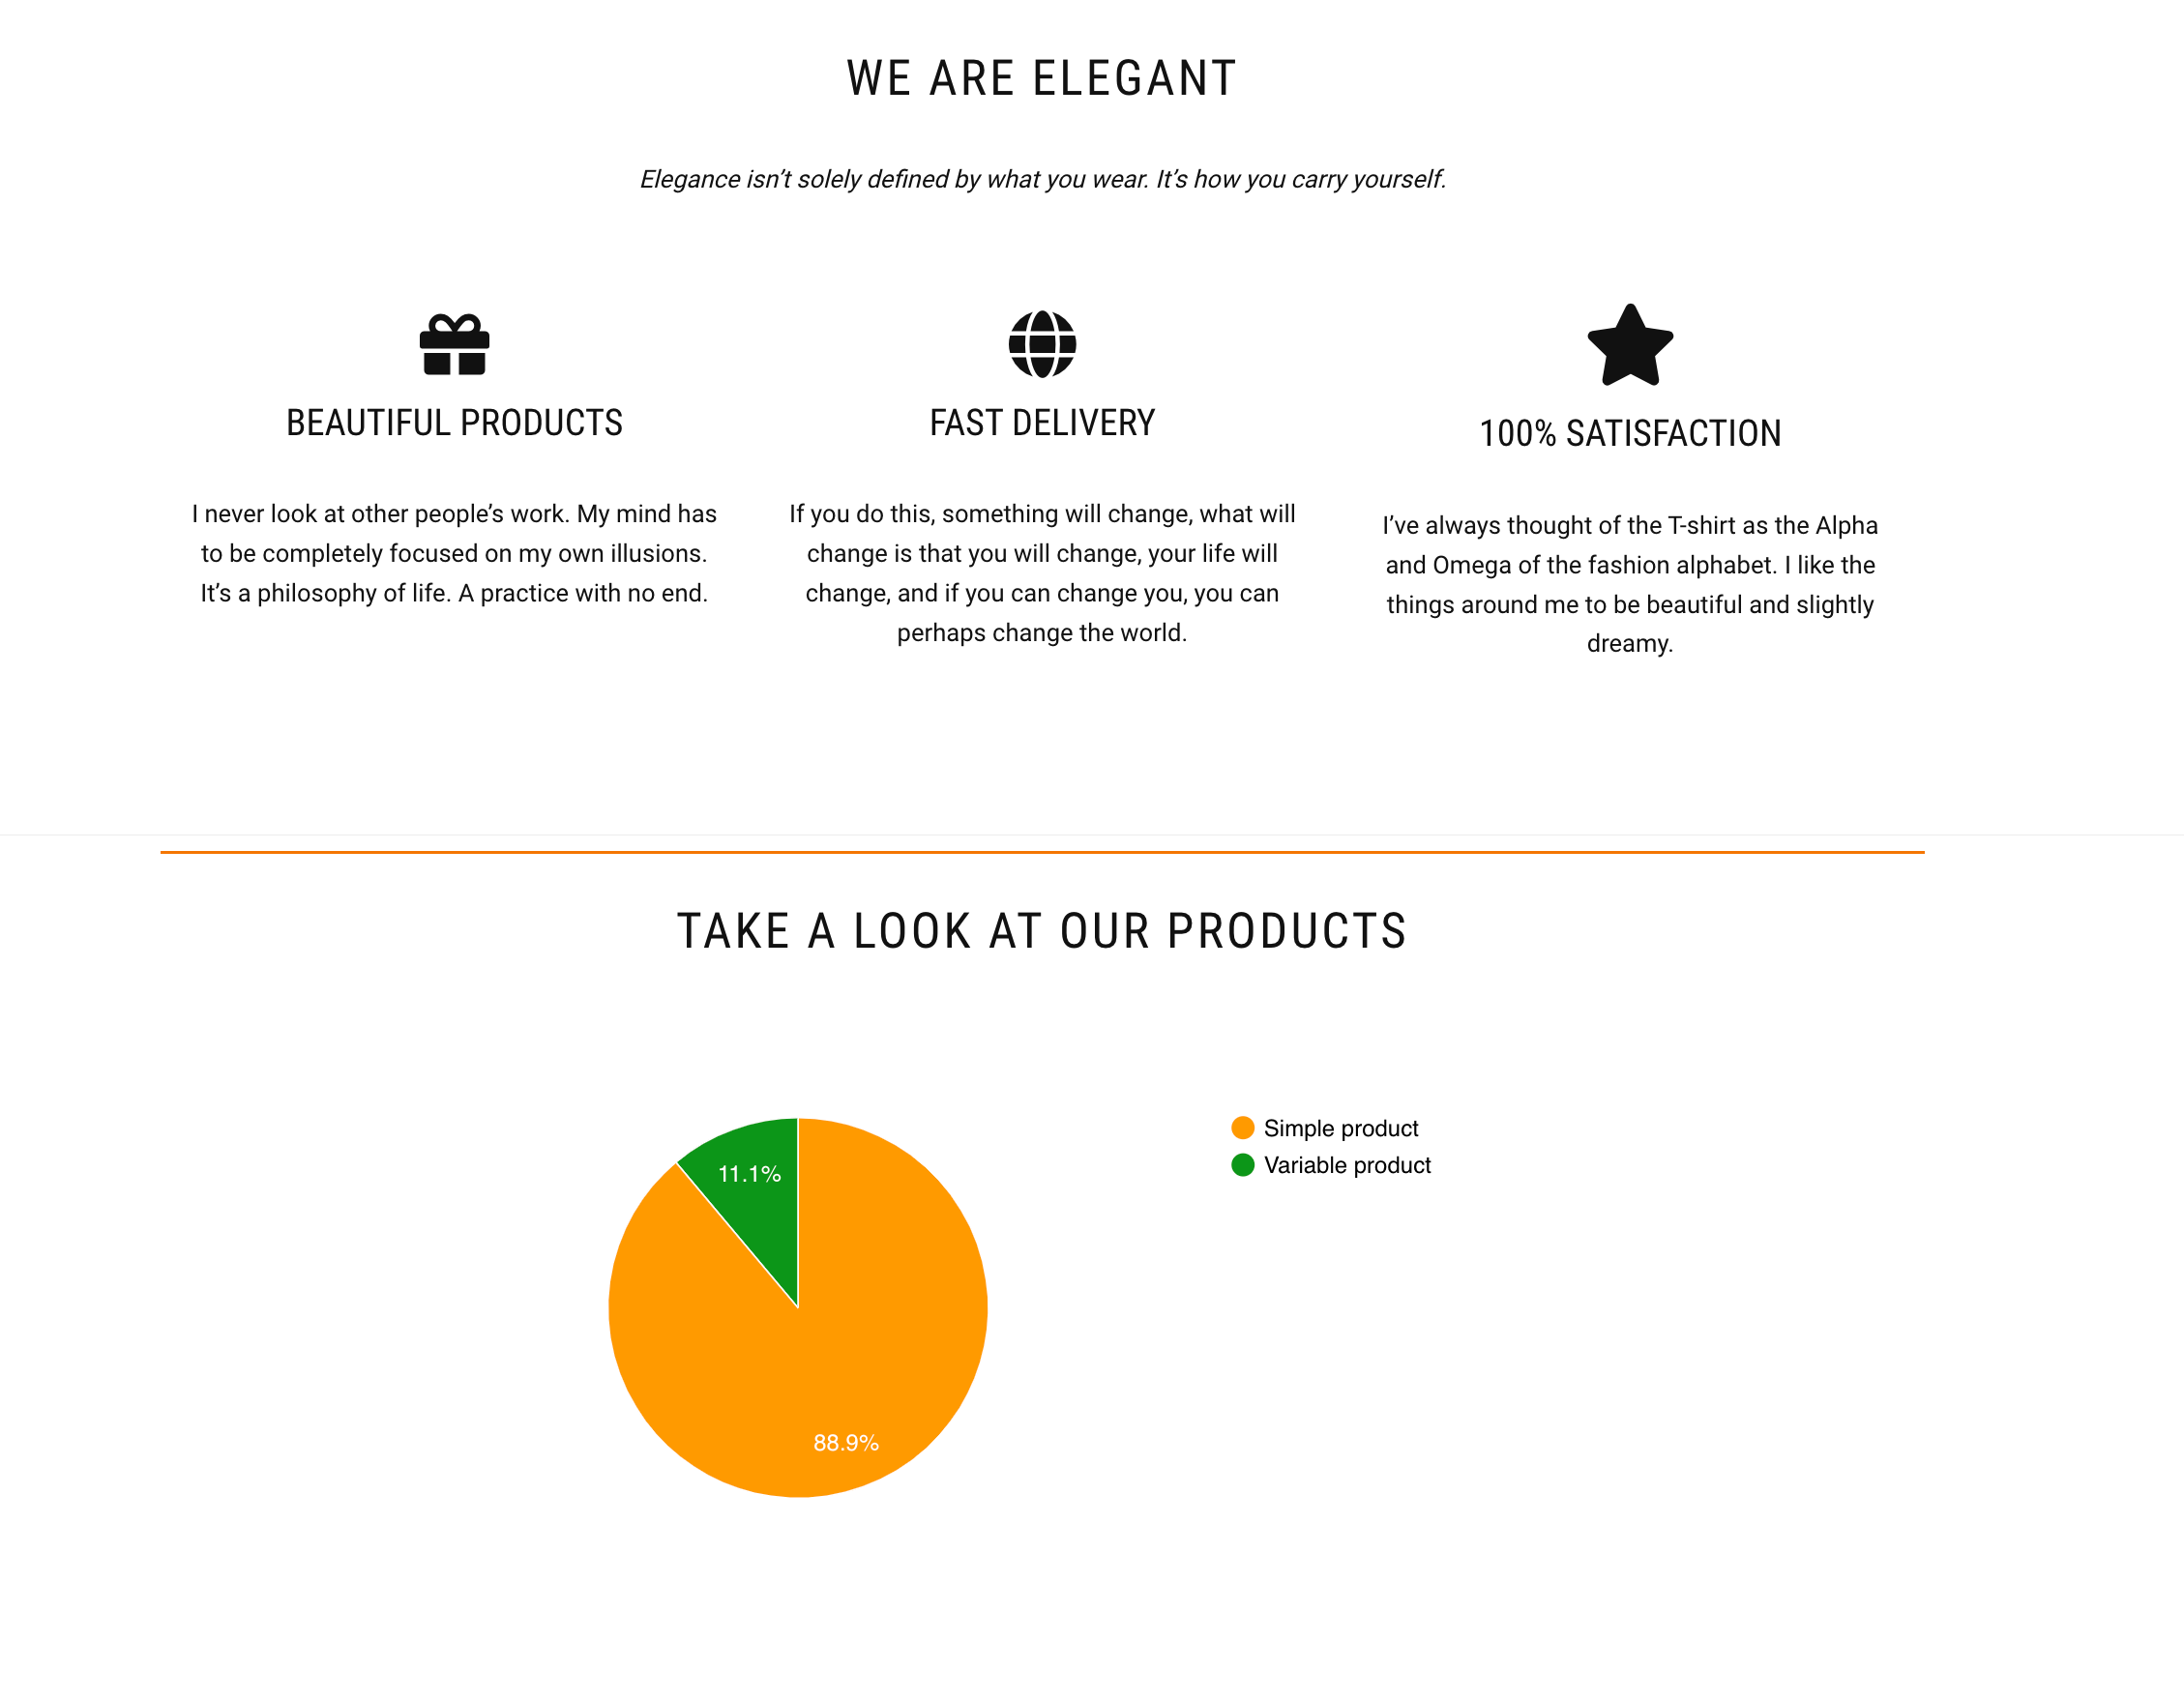
💡 Result