How can I edit a chart?
To customize a chart, you need to follow these steps:
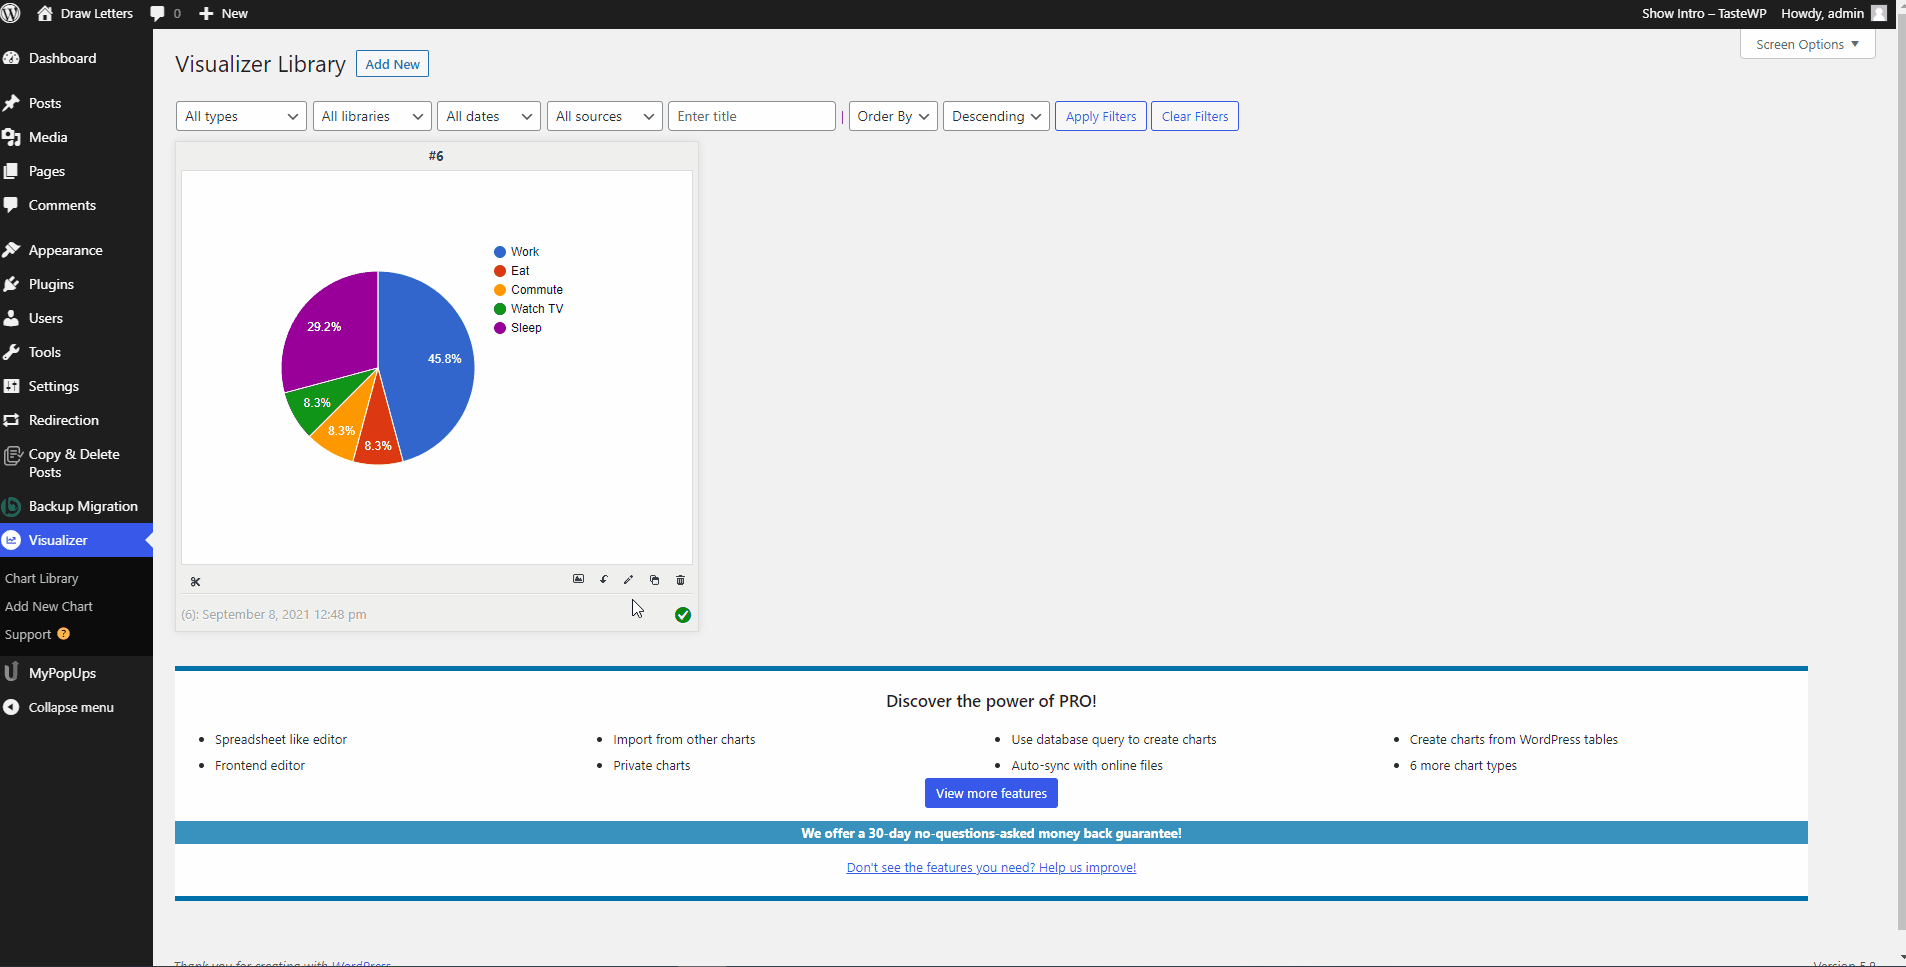
1. Navigate to Dashboard > Visualizer > Chart Library.
2. Select the chart you want to customize.
3. Click on the 🖌️ icon.
4. Go into the Settings panel and start making some changes.