How to translate Themeisle themes and plugins in your own language?
Premium Themeisle themes and plugins are 100% translation ready, come with .pot / .po / .mo files, and can be translated using any software such as POEdit, or with dedicated plugins like WPML, Polylang, TranslatePress, or Loco Translate.
| 🇺🇲 Site with just one language | 🌏 Multilingual site |
In this article
Translate themes/plugins hosted on wordpress.org
GlotPress is an open source tool used by WordPress for translations. Anyone can login to GlotPress and help translate themes or plugins hosted on wordpress.org.
As most of our free products are available on wordpress.org, here are the steps you can take to translate them in your own language:
Step 1. Visit the GlotPress Project. Login or Register a new account.
Step 2. Search for your locale and click on Contribute Translation for that locale.
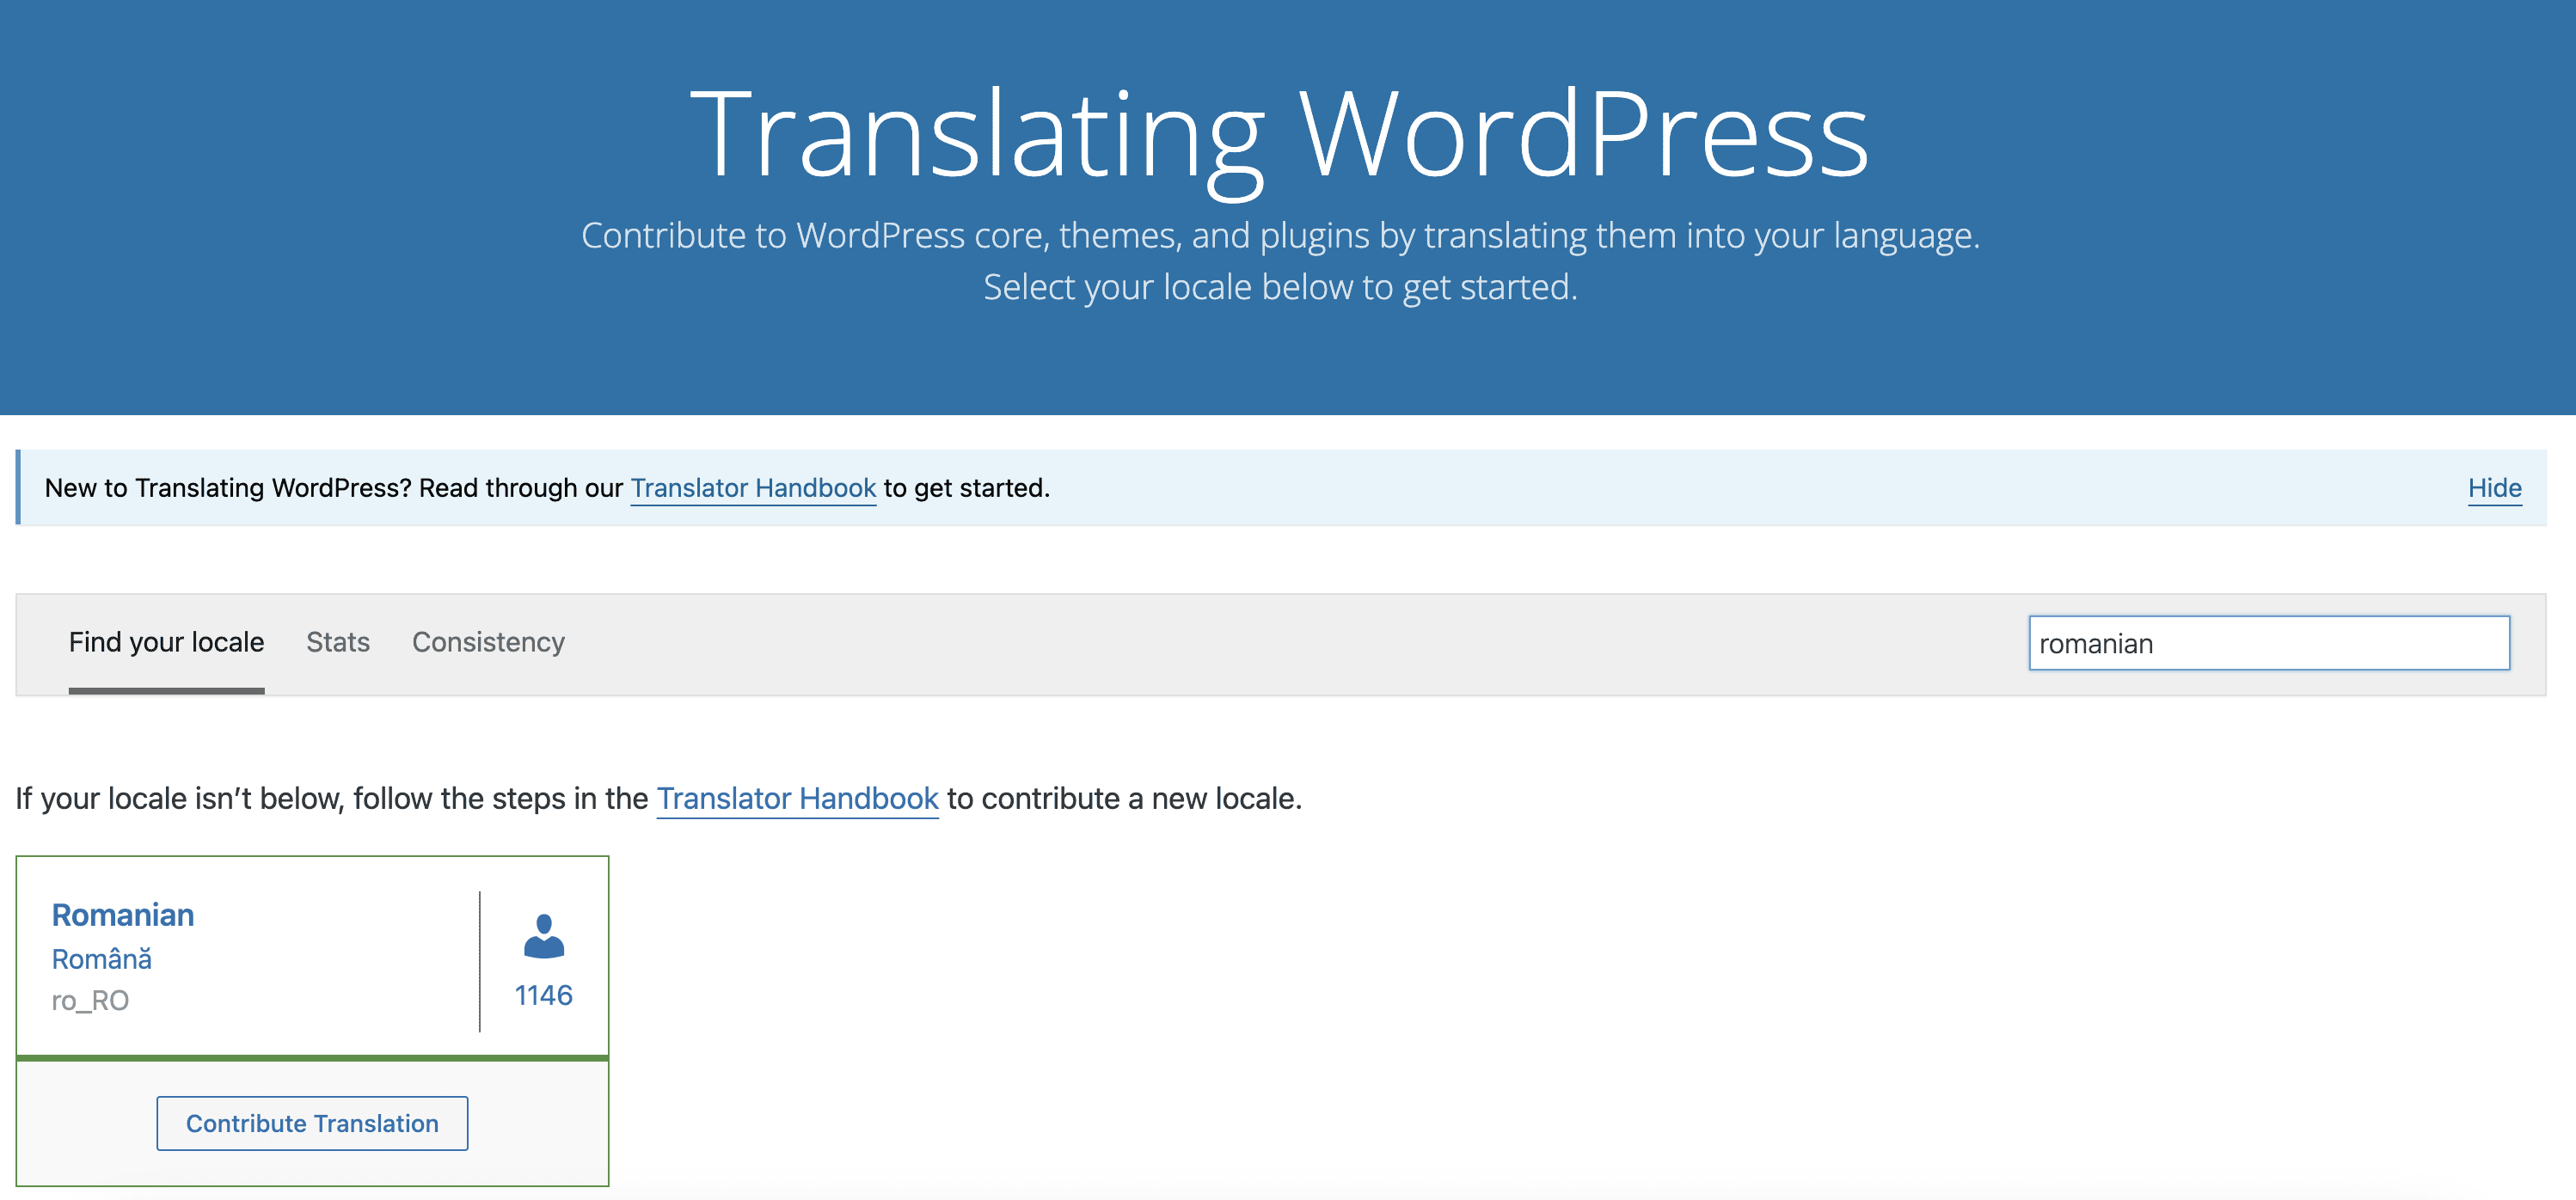
Searching for the Romanian locale
Step 3. Navigate to the Themes or Plugins tab ( depending on which product you want to translate ) and search for the project of your choice. In this case, it's the Neve theme.
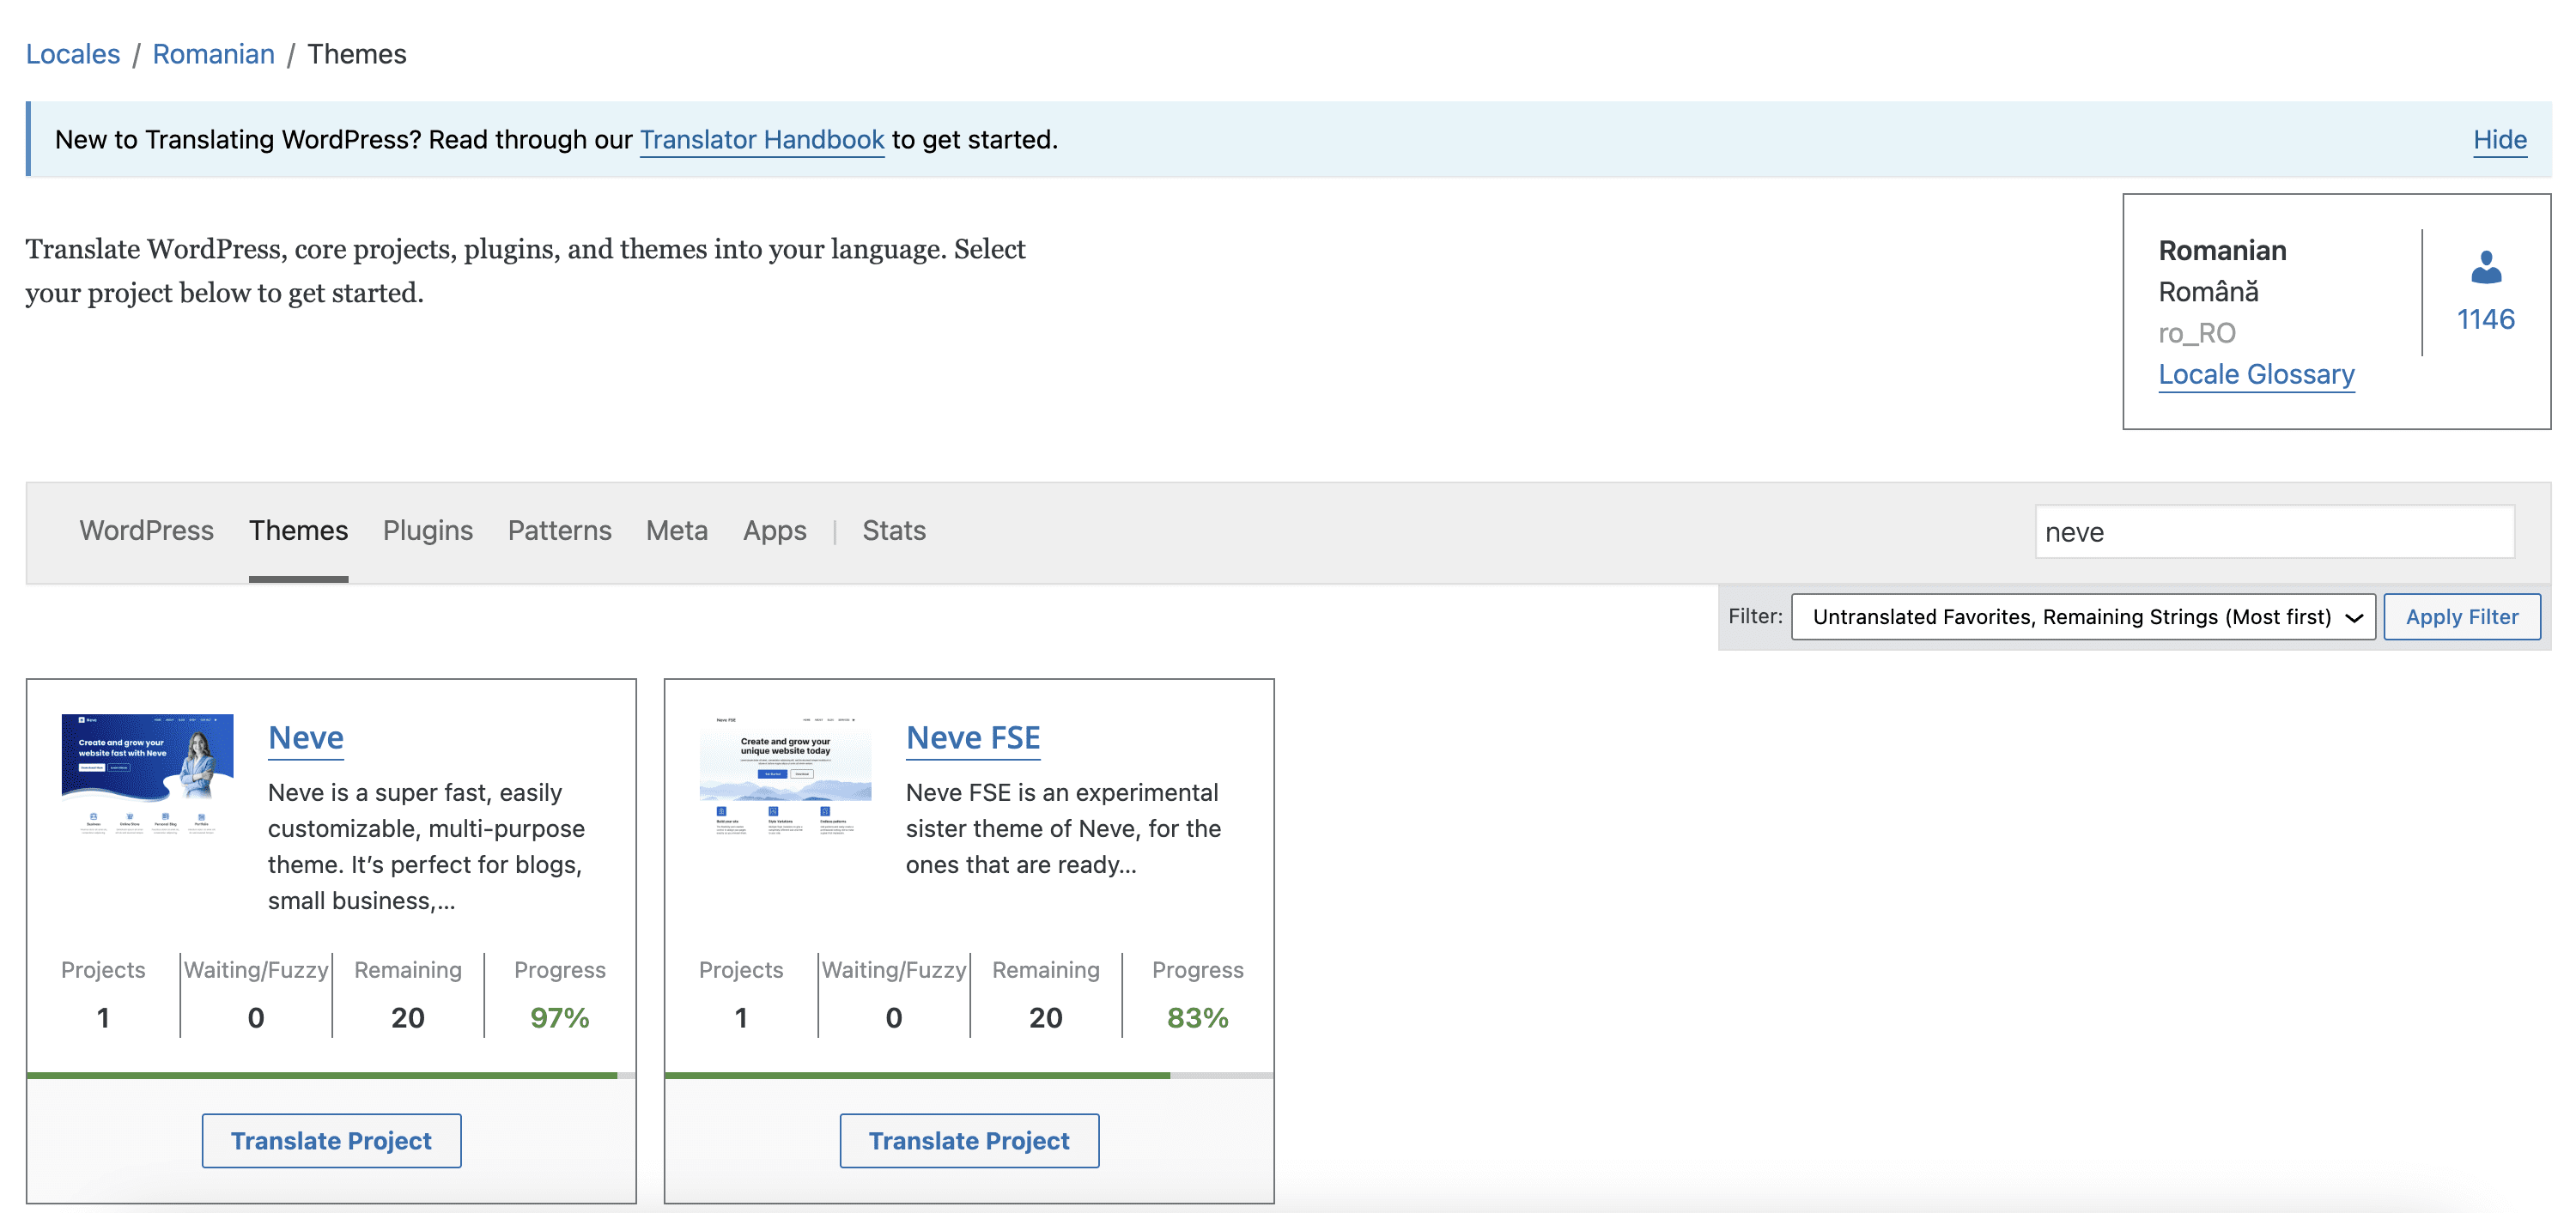
Seaching for the Neve theme to translate
Step 4. Click on Translate Project.
On the page, you will see the current state of translation of that language and a list of other translators who might have already contributed in translating the project.
Step 5. Click on the project name.
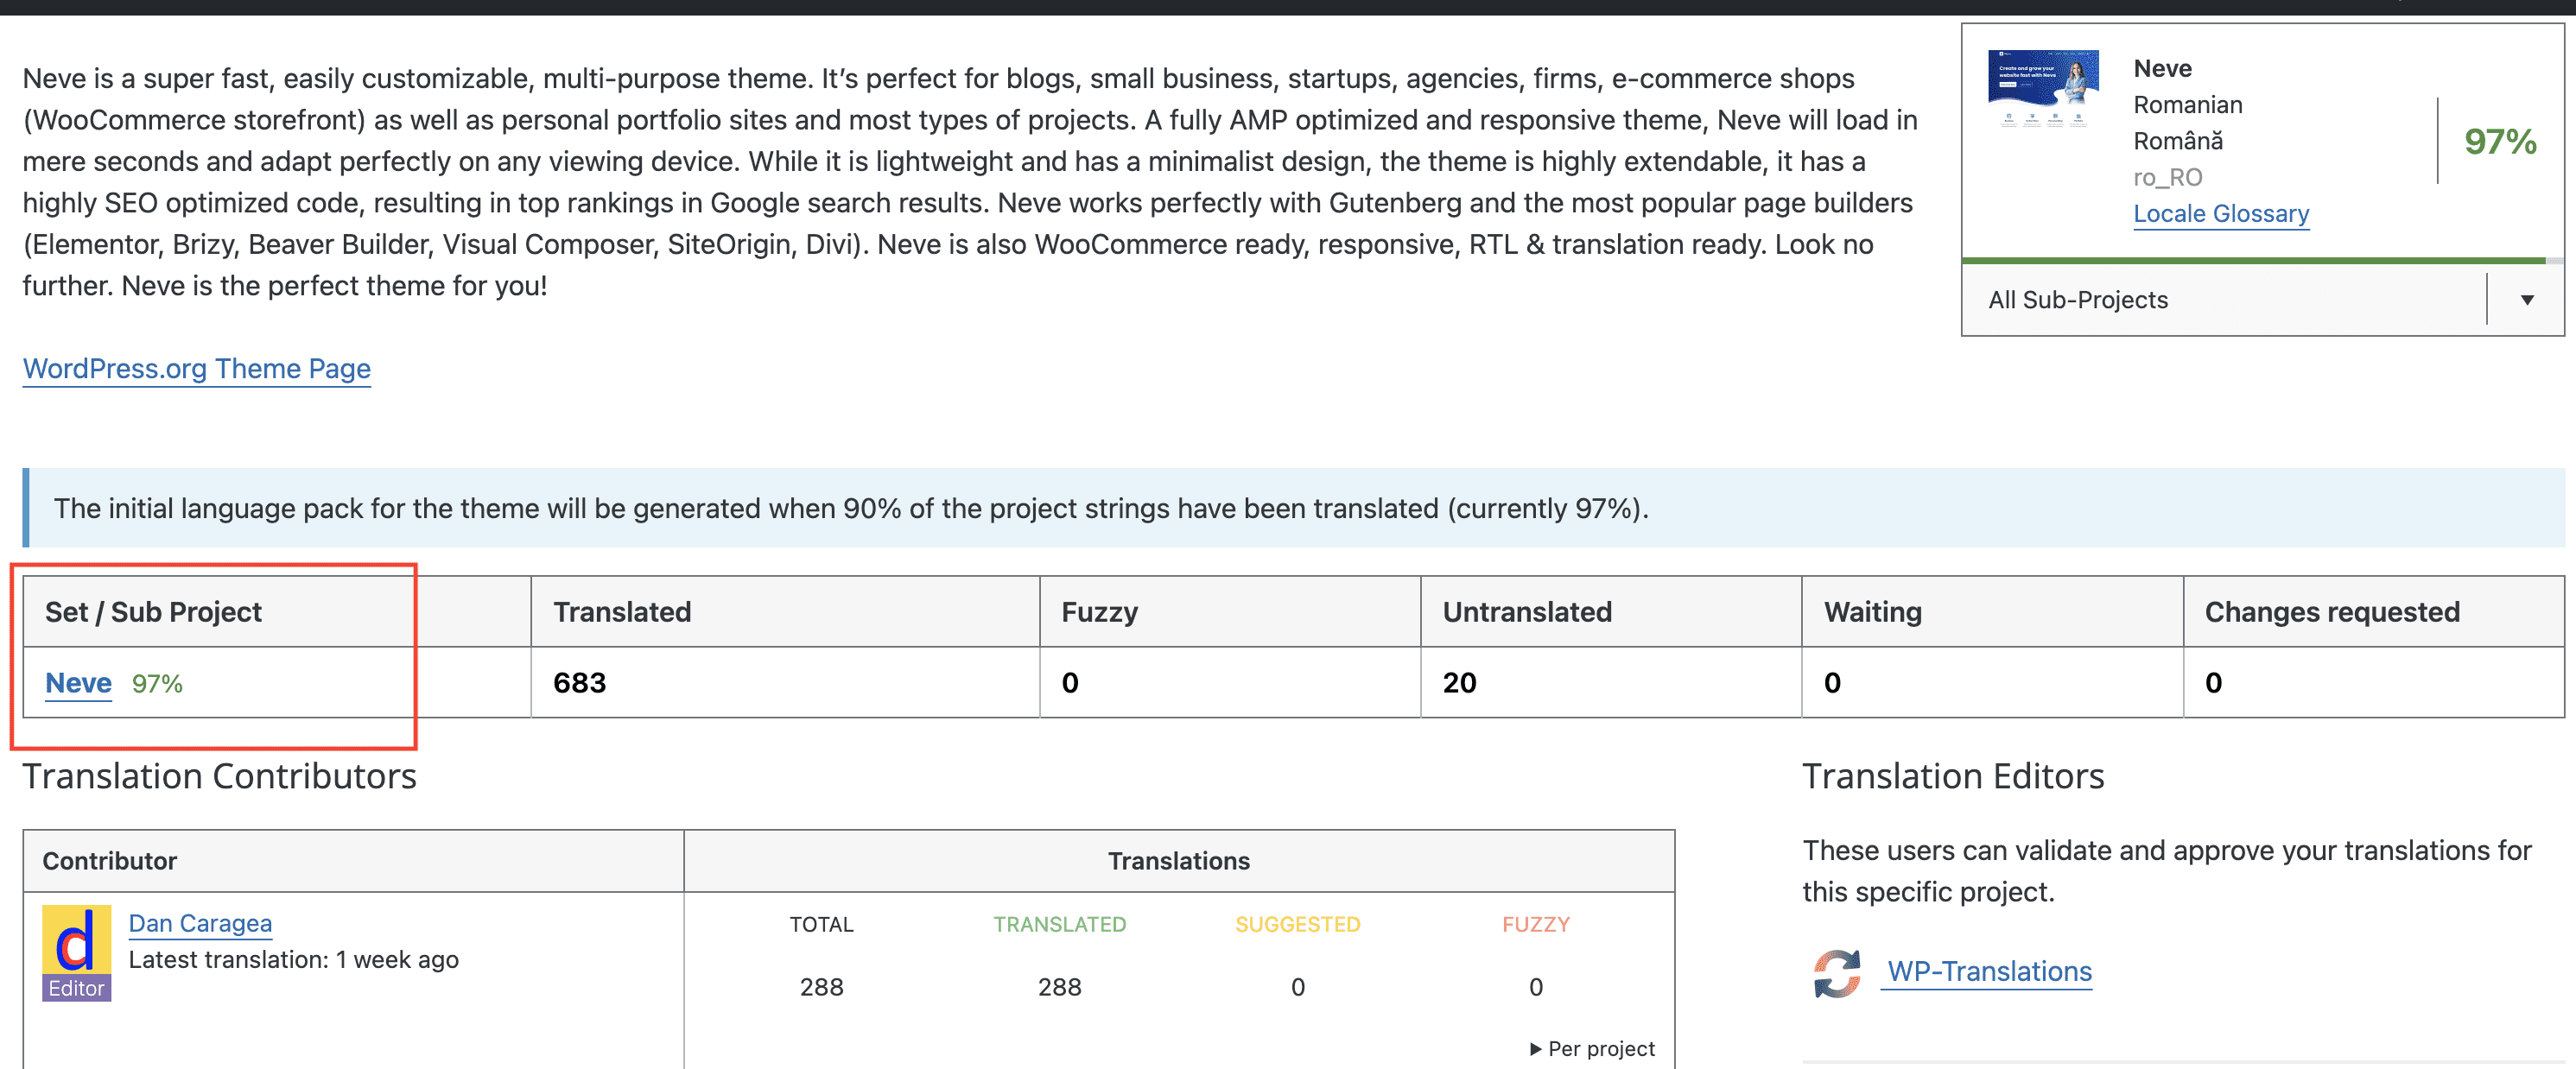
Select the project to translate
Step 6. Click on any string and translate it.
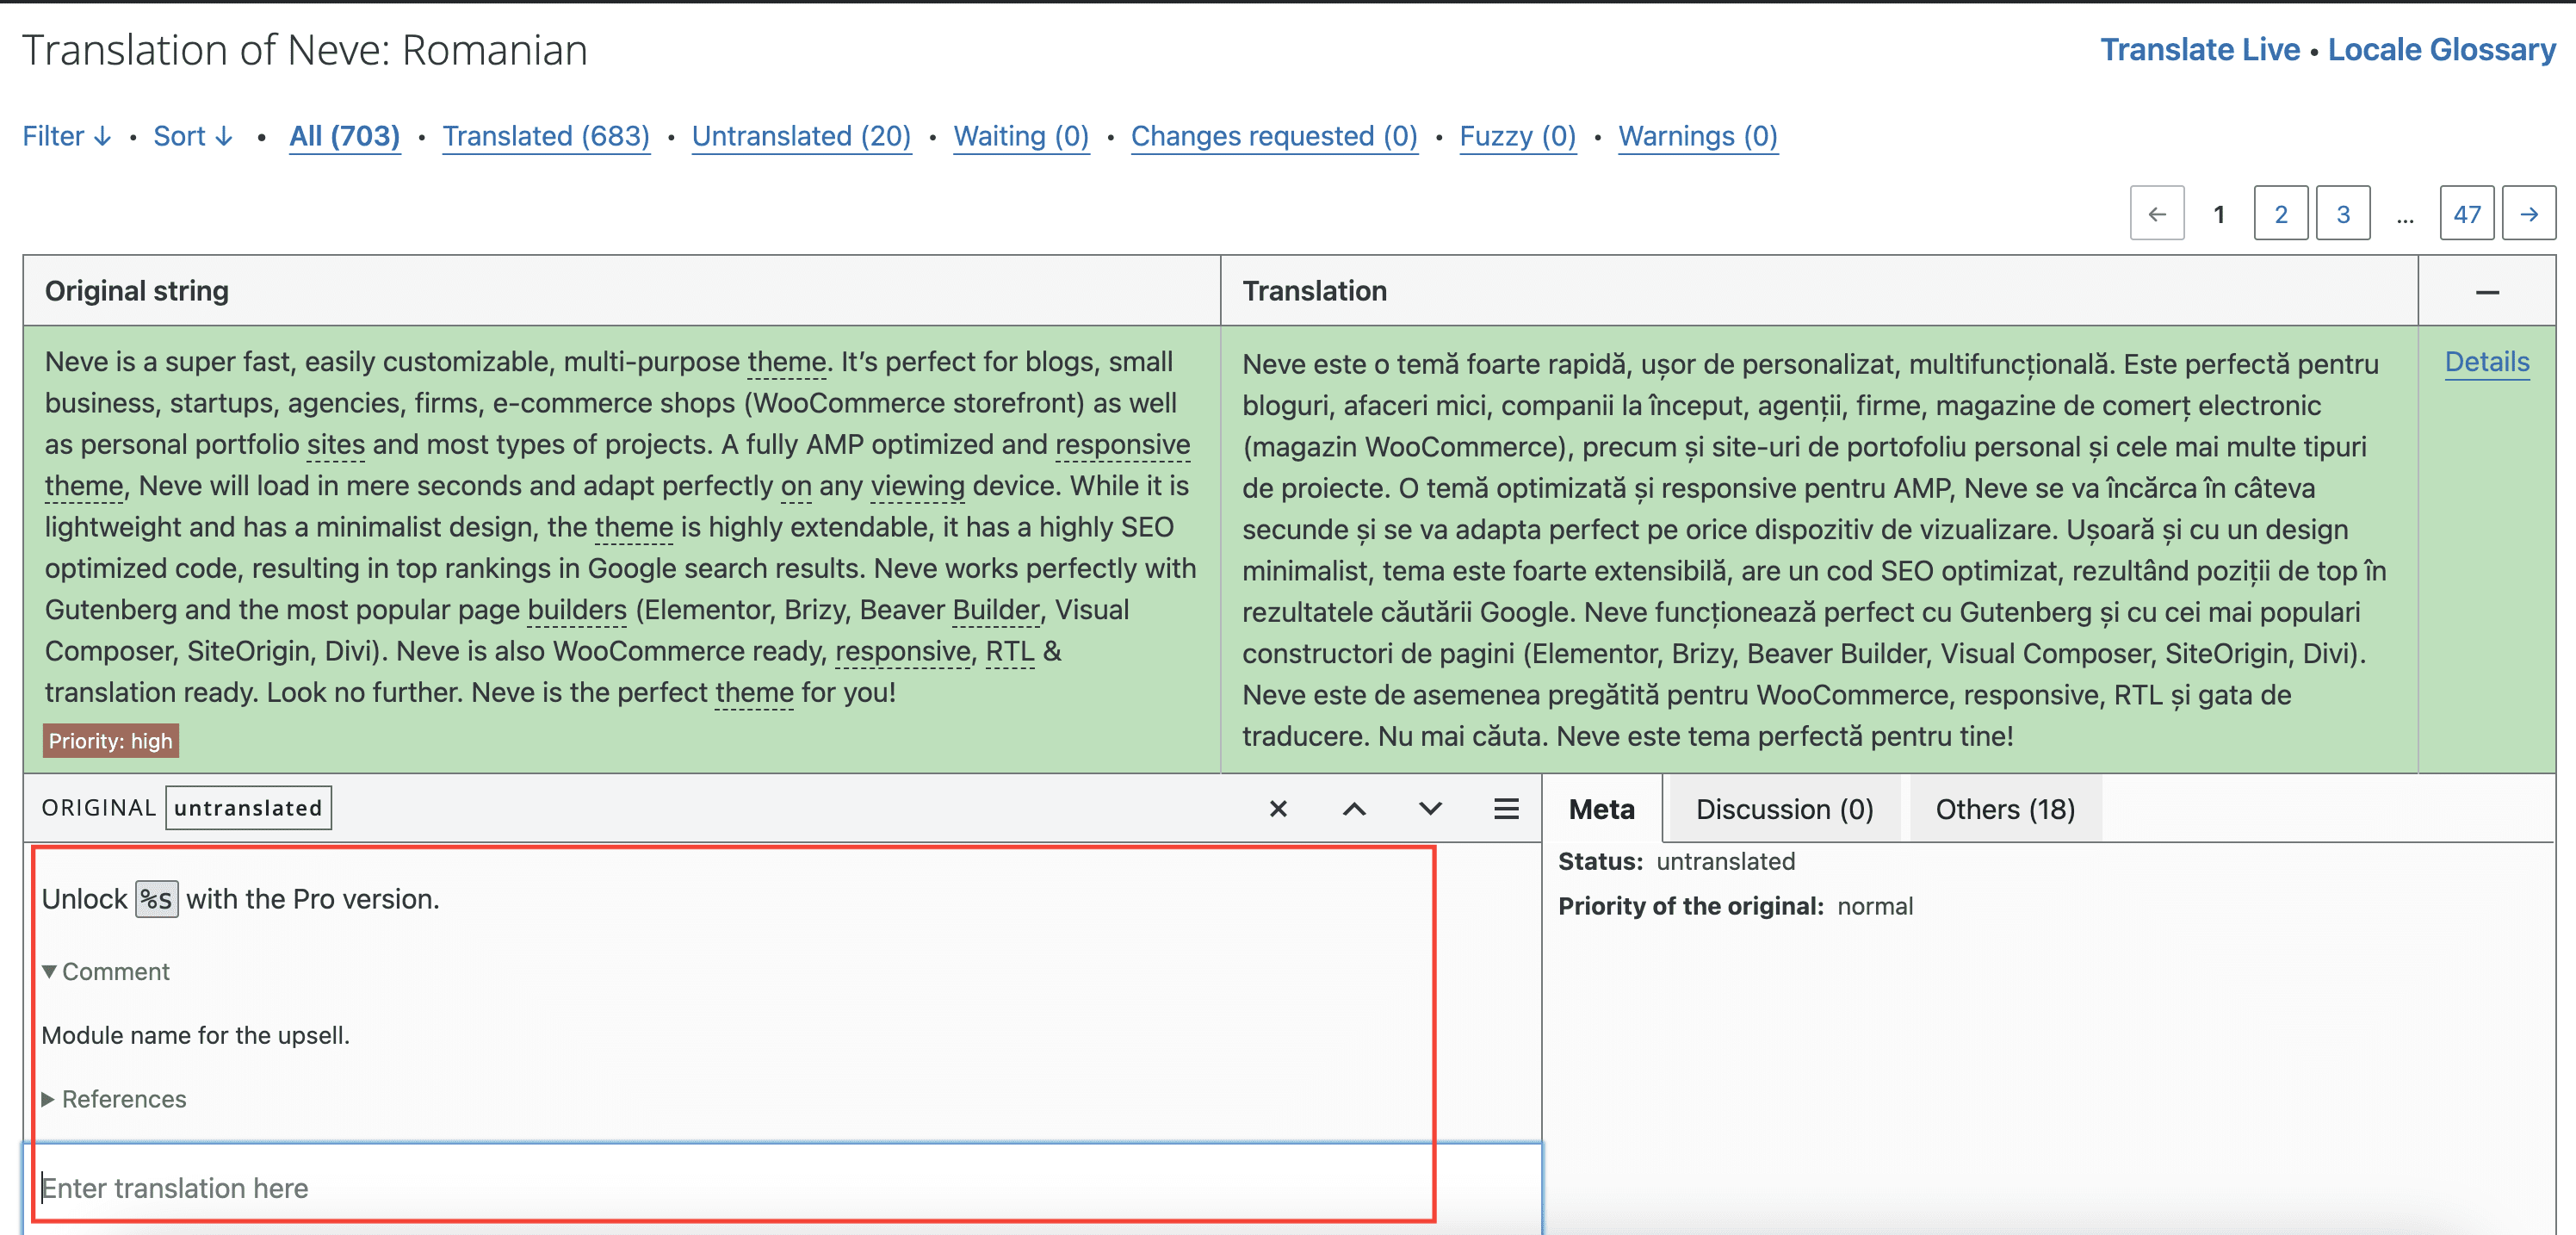
Translate a string
Once you translate the strings, project admins take a look at them and approve them.
Once the project admin approves the translations or makes updates to the string, the latest translation automatically appears as an update in the WordPress backend.
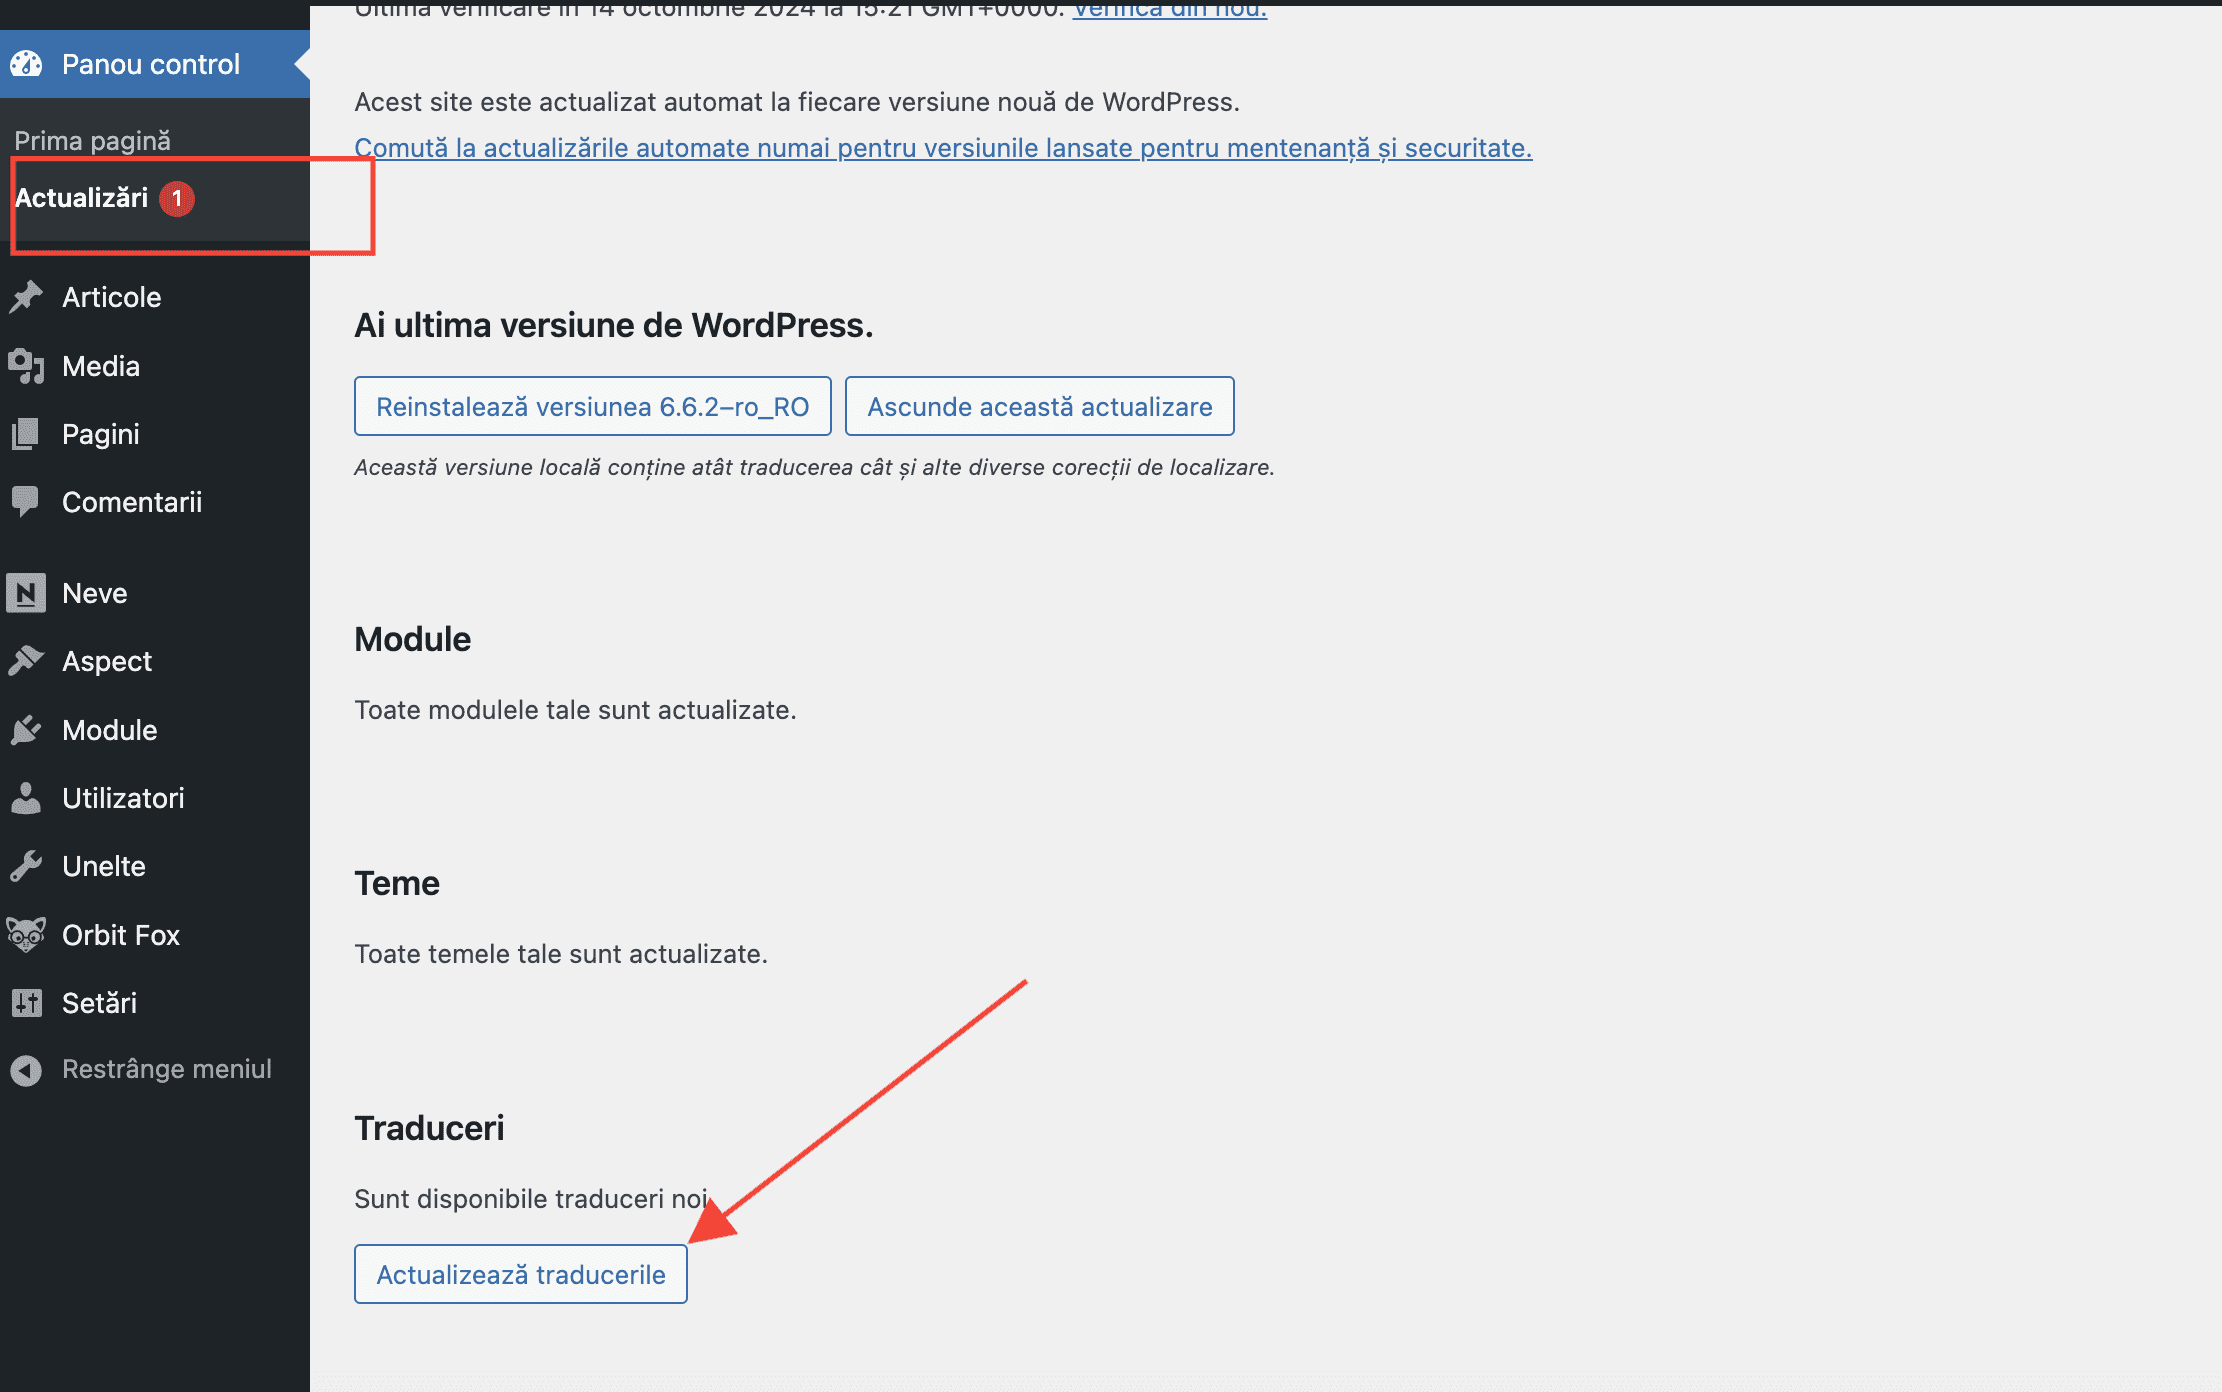
Get the latest translations available in your WordPress dashboard
Translate with POEdit
To translate strings for any theme/plugin using POEdit, follow these universal steps:
- Download and install Poedit from the POEdit website.
- Connect to your website using FTP and navigate to the theme/plugin folder, typically found at
wp-content > themes > your-theme-name > languagesfor themes orwp-content > plugins > your-plugin-name > languagesfor plugins. - Look for the
.potfile, which is the template for all translations. - Copy this
.potfile and rename it to match your language and country code,theme-name-lang_COUNTRY.pot(e.g., for Romanian, it would betheme-name-ro_RO.pot) orplugin-name-lang_COUNTRY.pot(e.g., for Romanian, it would beplugin-name-ro_RO.pot). - Download the renamed
.potfile to your computer. - Open the
.potfile with Poedit, translate the necessary strings, and save your changes. Saving will also create automatically two files:.moand.po. Make sure they have the same name as the pot file. - Upload both the
.poand.mofiles back to the languages folder of your theme/plugin on your server.
Translate with Loco Translate
While Loco Translate can successfully translate strings into any language you’ve added, only one translation can be activated at a time. That’s because the plugin relies on the core WordPress language switcher. To show translated strings to your visitors in a particular language, you need to select that language as the default in your site’s settings.
1. Setup the Loco Translate plugin
Install the Loco Translate plugin, using these instructions.
2. Choose your site language
Head to the Settings > General admin screen and scroll to the bottom. You should see a dropdown list with the label "Site Language". Changing this will set a new default language for all site visitors.
3. Translate your theme/plugin
Head to the Loco Translate > Themes or Plugins and select the theme/plugin of your choice.
After that, click on the New language button to start the translating process.
For full details on how to use Loco Translate, we recommend you follow the official recommendations from Loco Translate.
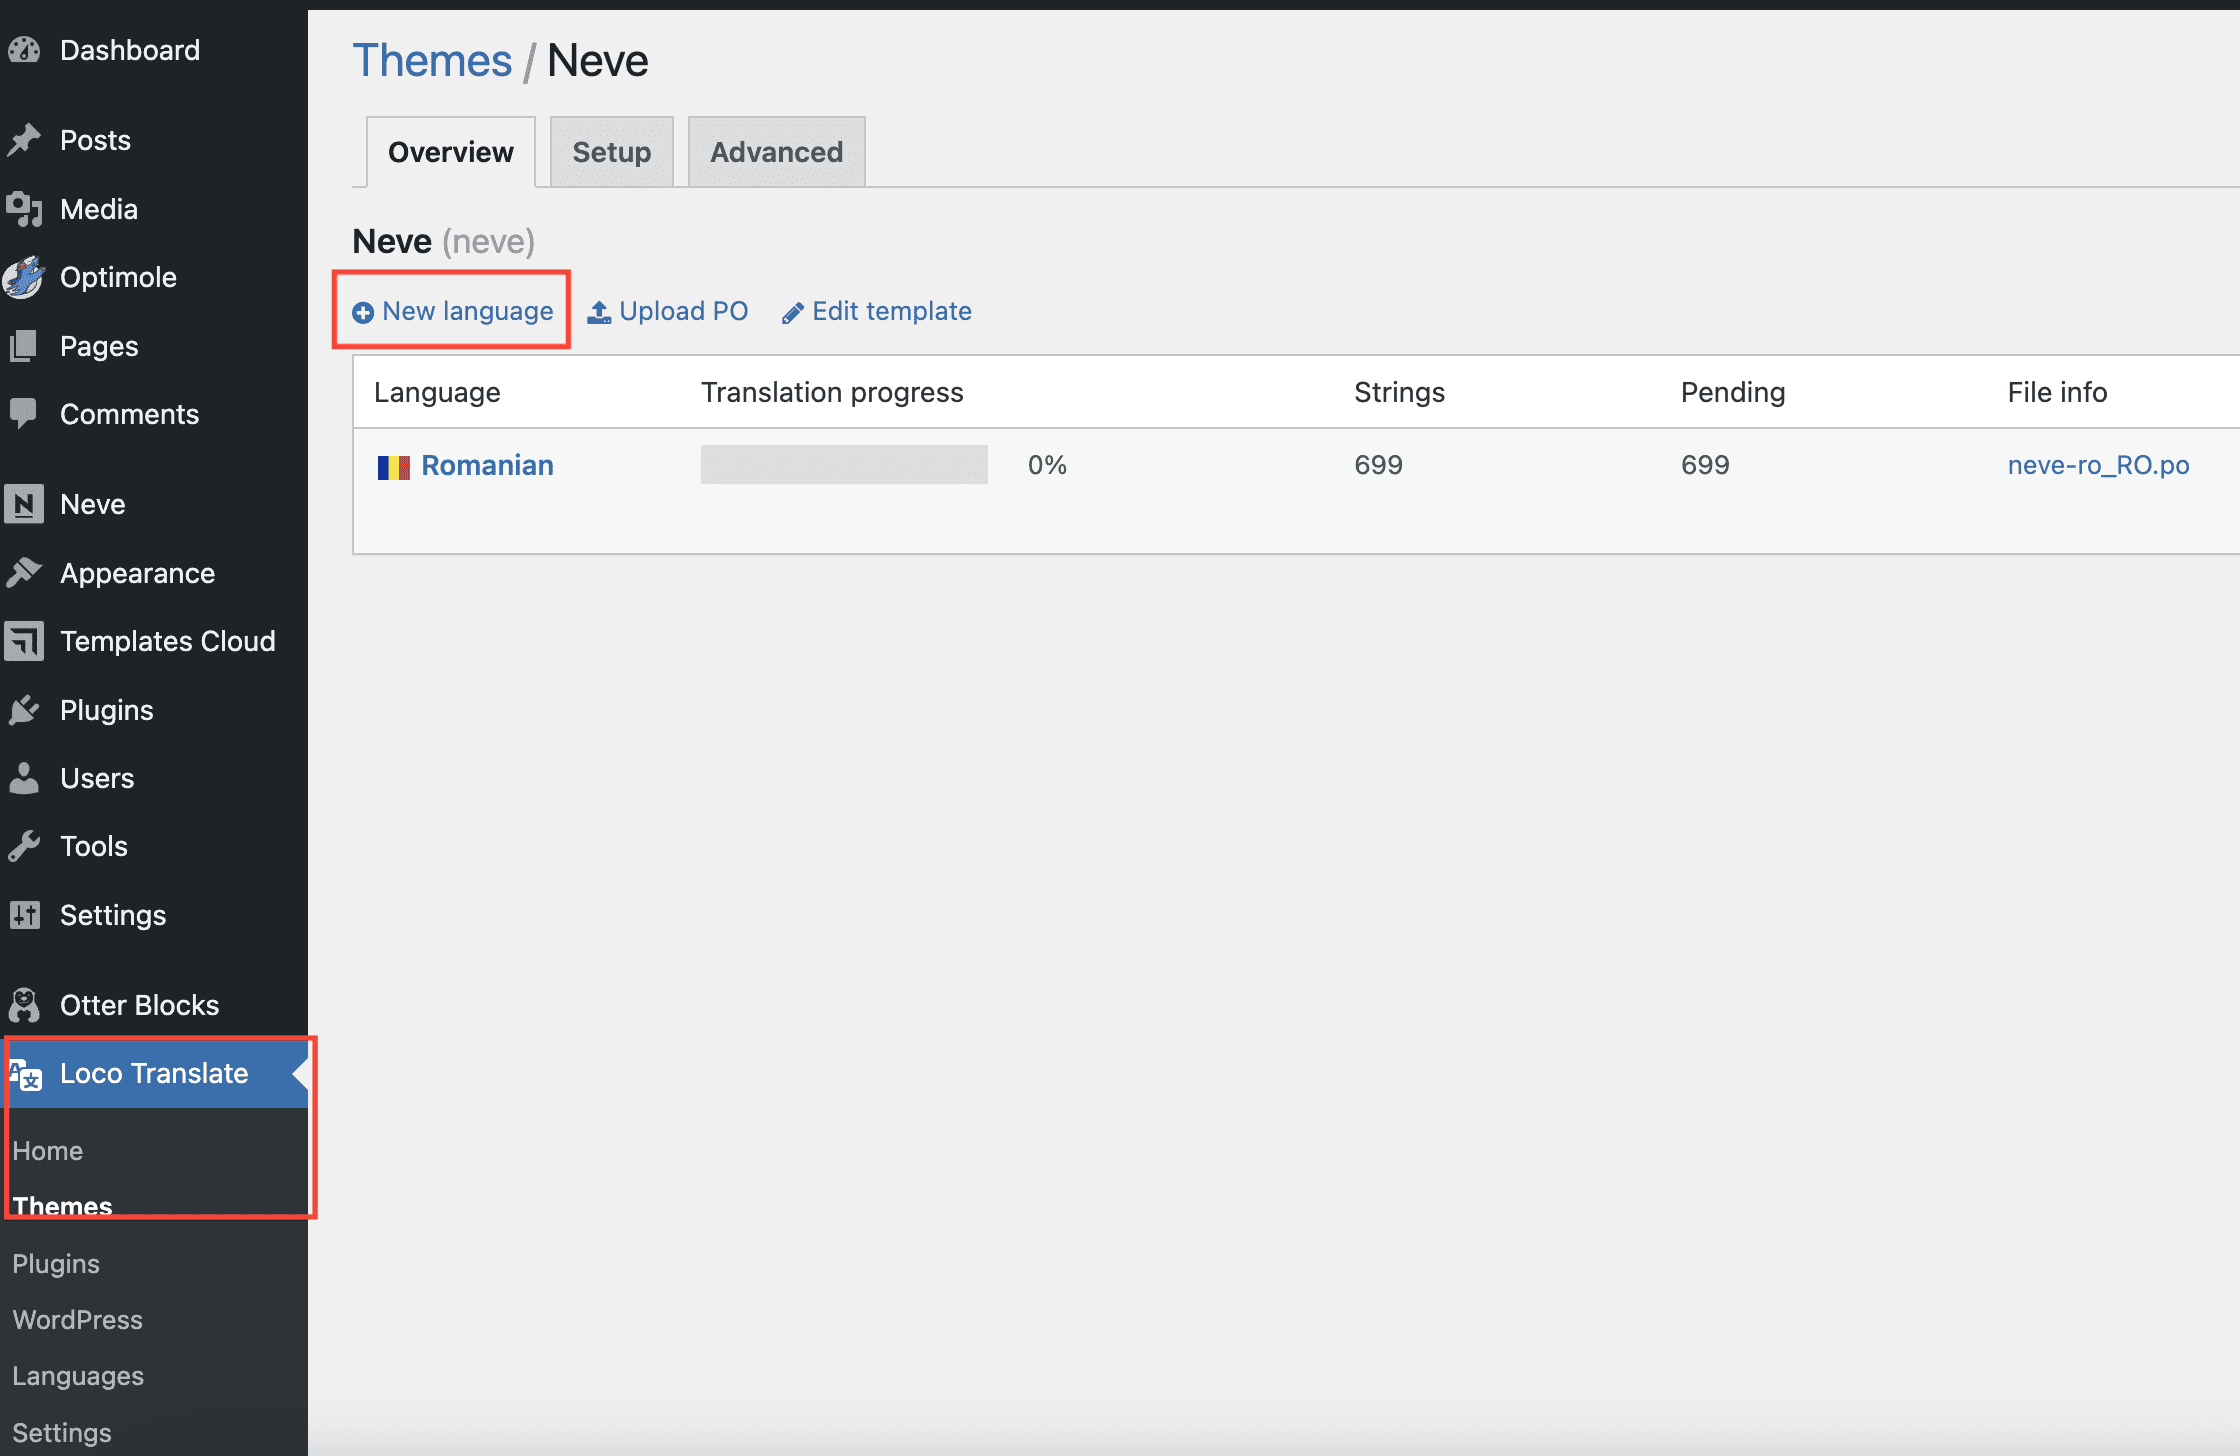
Add new language for theme in Loco Translate
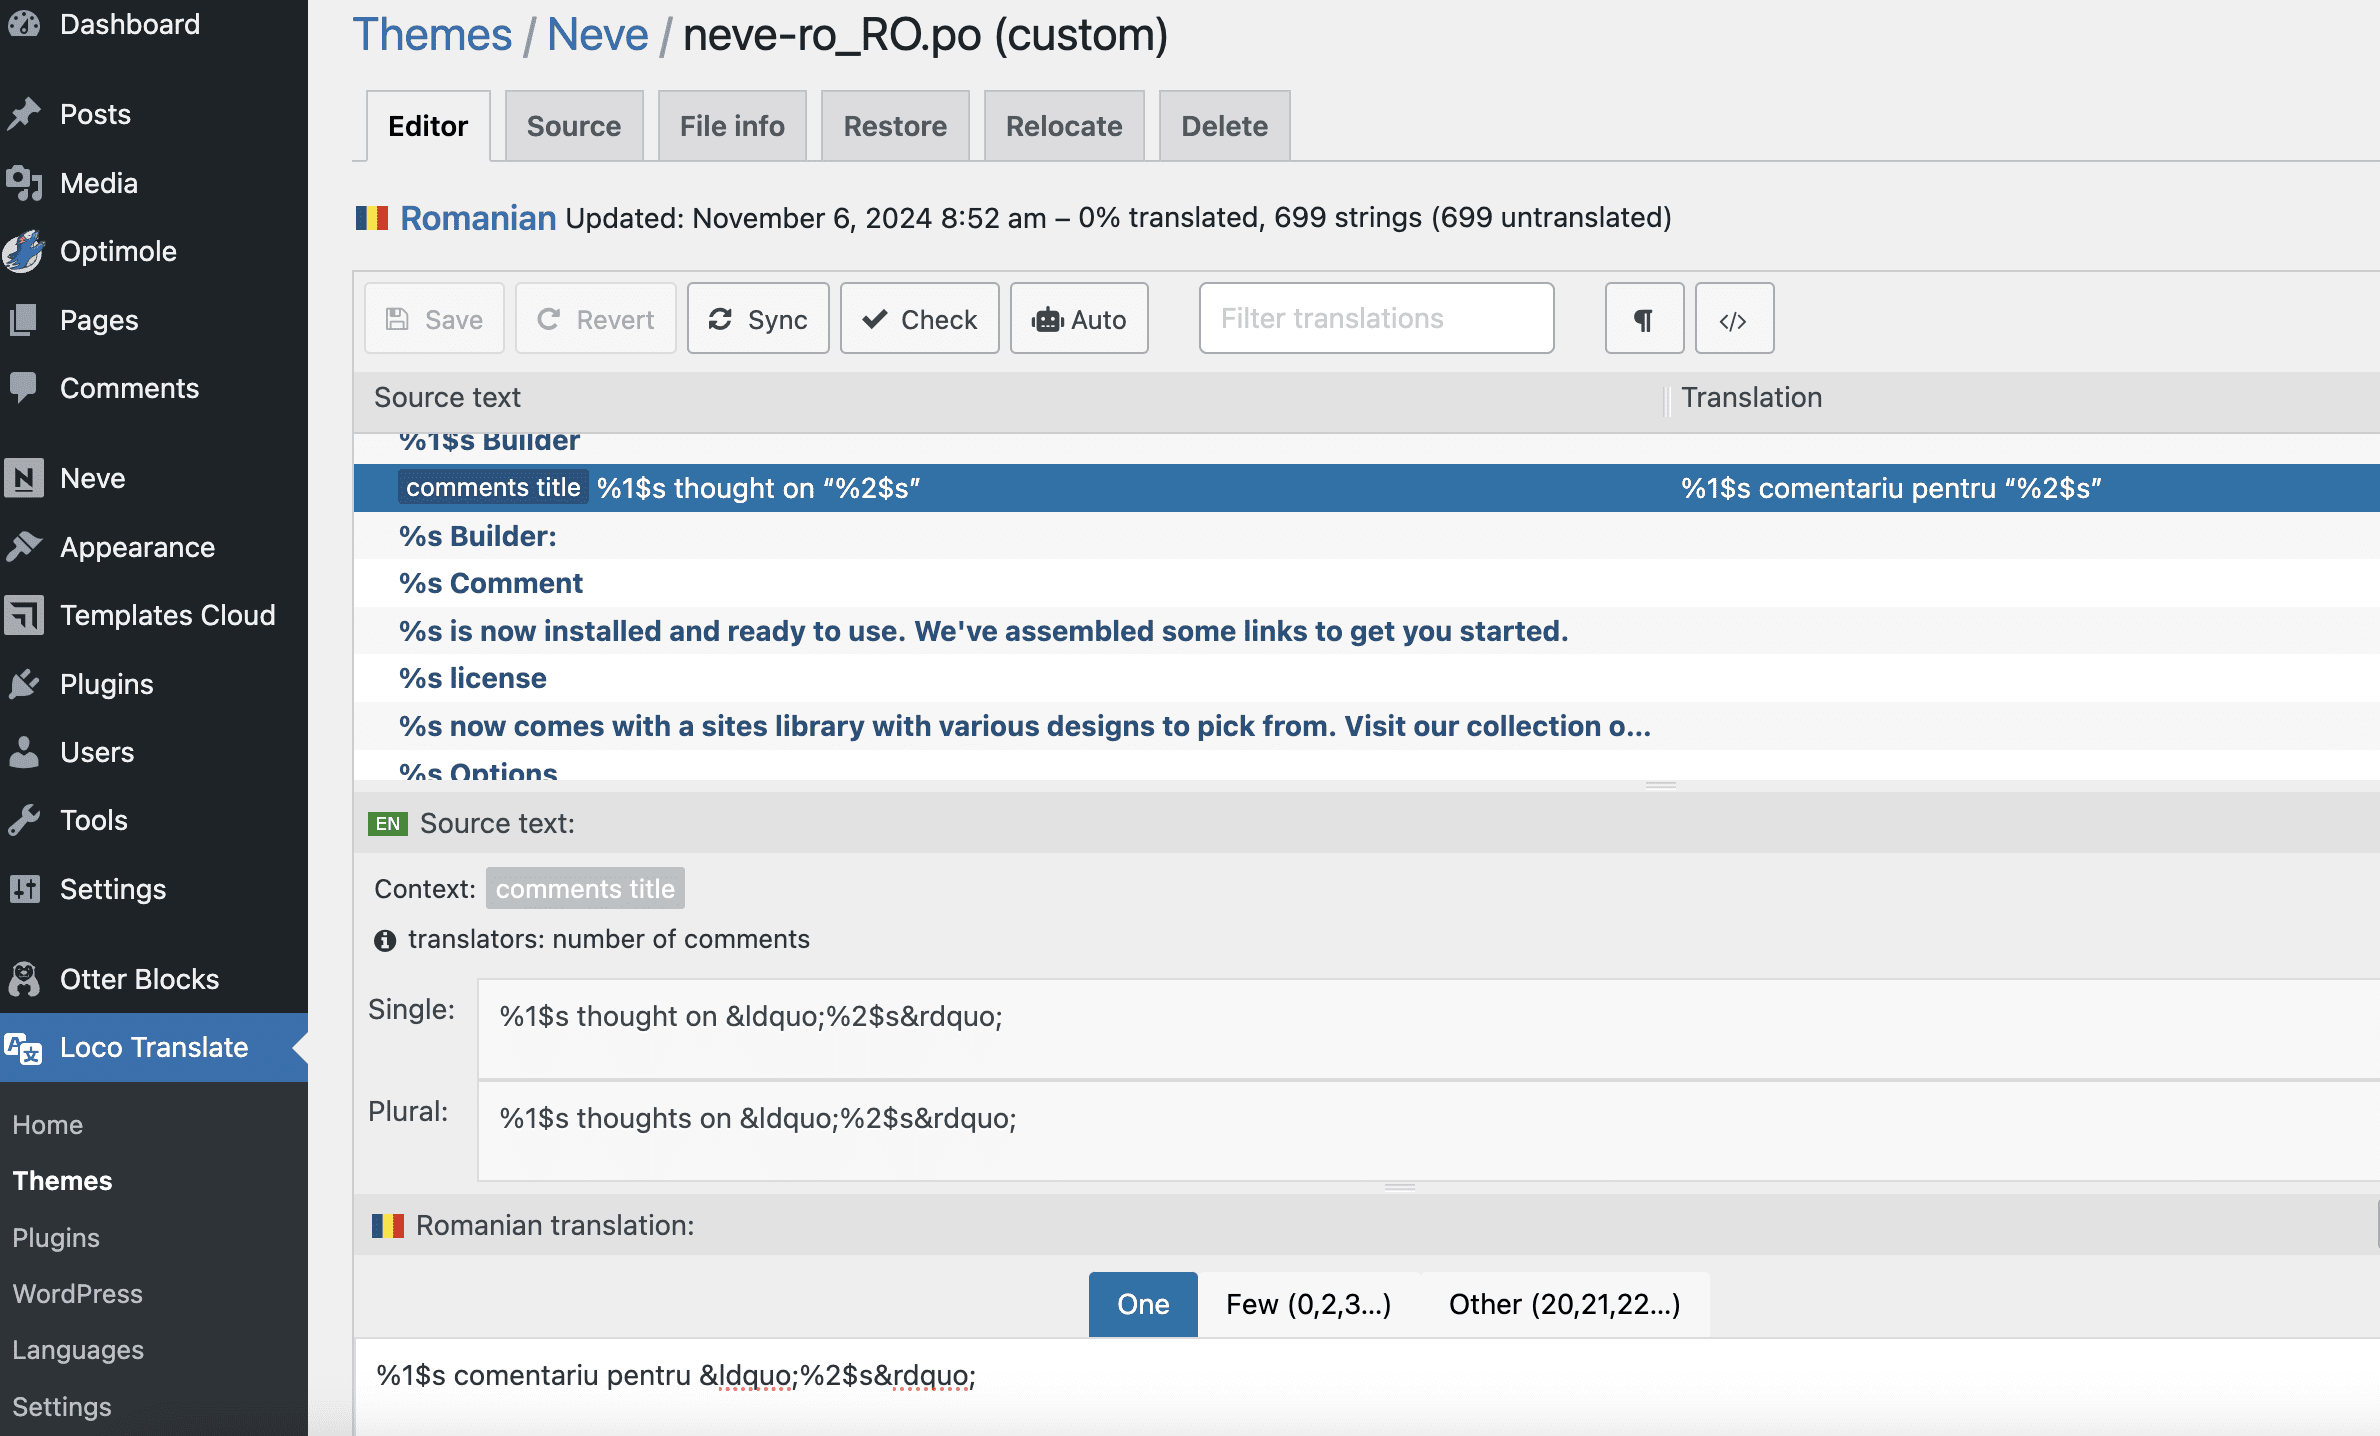
Translate strings in Logo Translate
Choose a translation plugin for a multilingual site
When selecting a WordPress translation plugin, there are various factors to consider, like: ease of use, features offered and price. The best plugin for you will depend on your specific needs and budget. While this is a personal decision for everyone to make, we can share a few things to consider about some popular solutions:
| Plugin | Pros | Cons |
| Polylang | Offers a free version with basic features. Benefits from a large and active community. | May require more advanced configuration for complex multilingual setups. |
| WPML | Powerful, flexible, and offers a wide range of features | Can be complex for beginners. Does not offer a free version. |
| TranslatePress | Offers a free version with basic features. User-friendly, easy to use, and allows you to translate directly on the frontend. | Might not be as feature-rich as WPML |
Translate with Polylang
1. Setup the Polylang plugin
For this part (plus, for creating menus and widgets for each language of your site), we recommend you follow the official recommendations from Polylang.
2. Translate posts and pages with Polylang
Note: The process is similar for posts and pages.
To translate a post, navigate to the WordPress Dashboard > Posts, find your post, and click on the plus sign corresponding to the language that needs a translation.
That moment, a new post is created.
Just add the translated title and content for the new post.
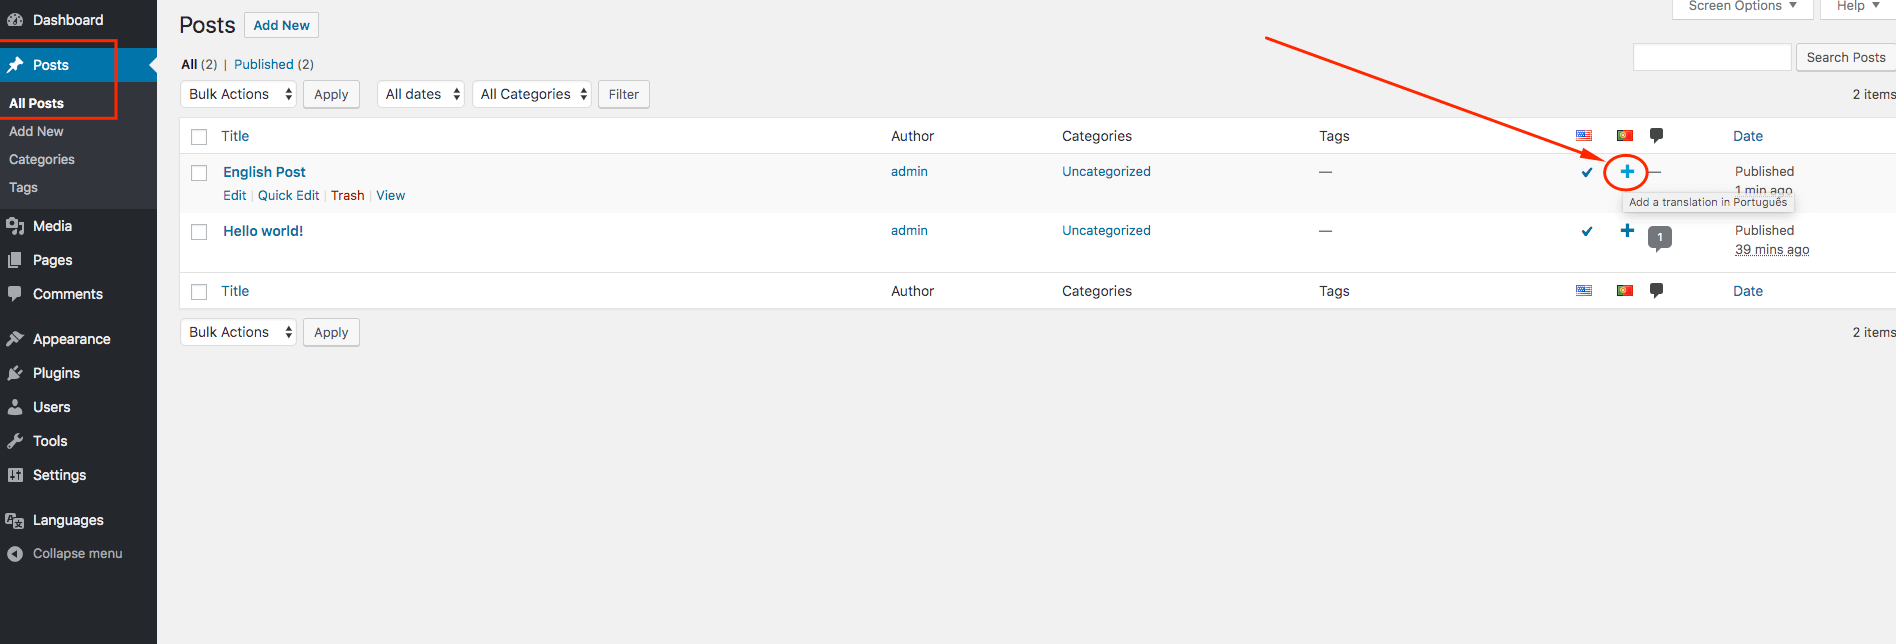
Create the corresponding post for the other language in Polylang
Editing the post language can also be done while editing the post.
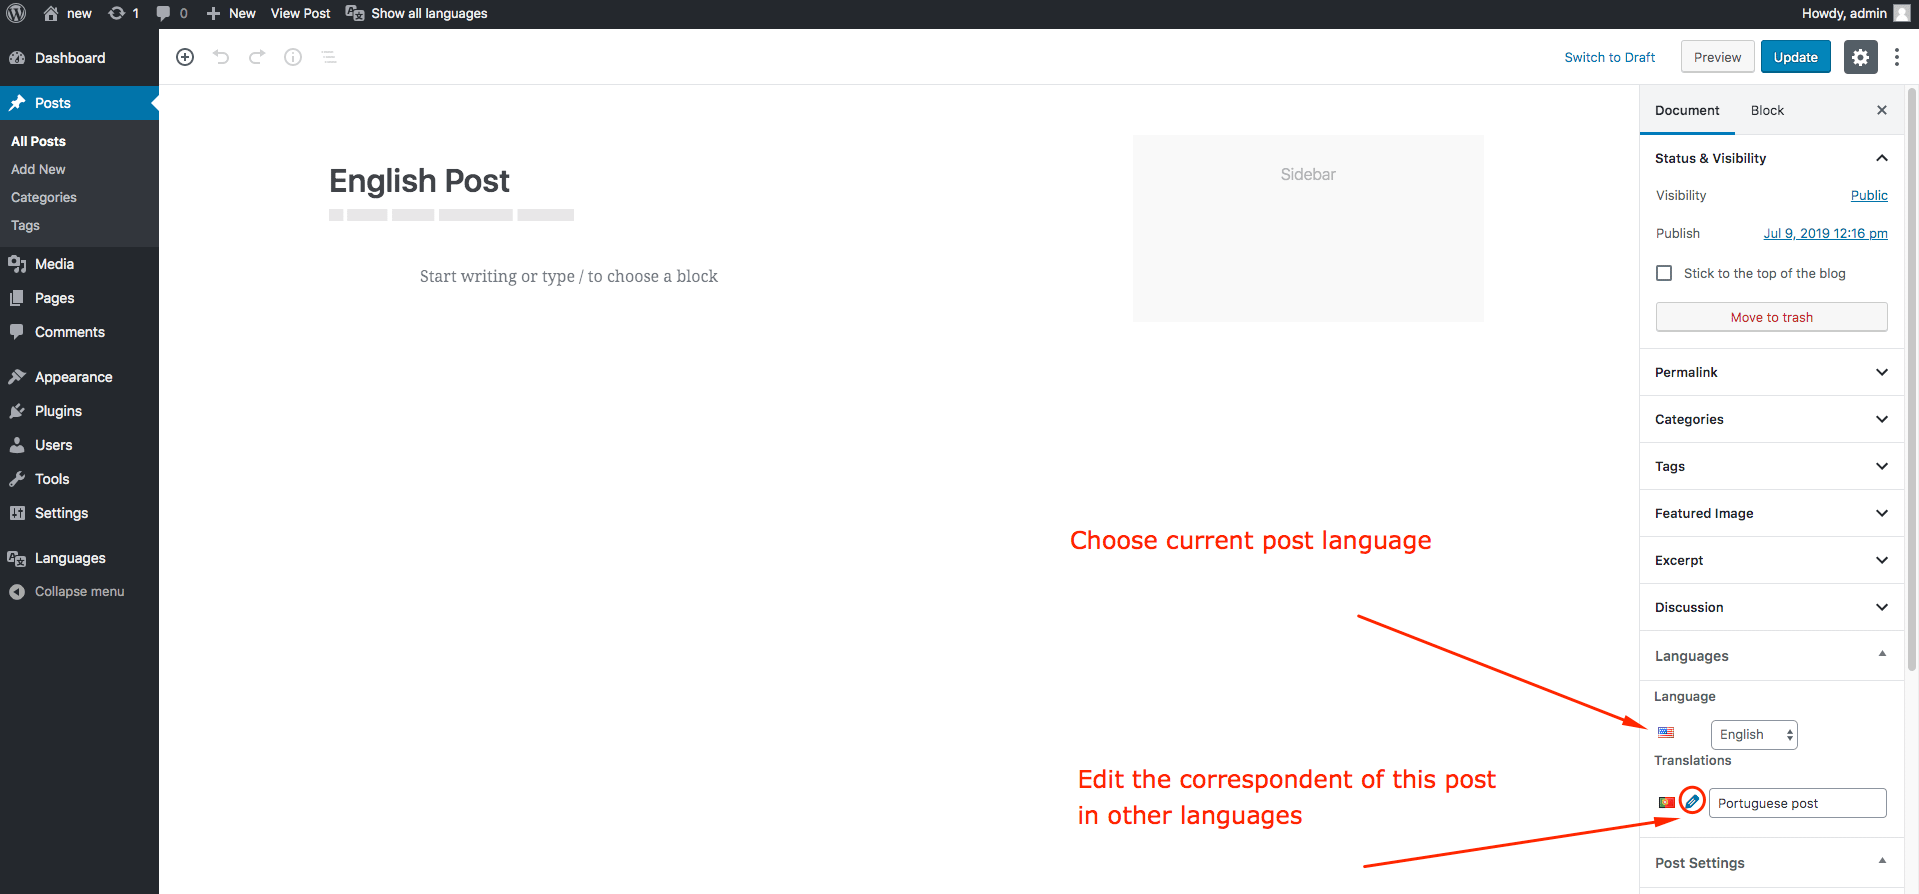
Create the corresponding post for the other language in Polylang
Important note: Some of our themes like Hestia Pro, Zelle Pro, and ShopIsle Pro have their frontpage built using options from Customizer. In these cases, to translate the frontpage, follow the steps from the next section.
3. Translate theme built-in sections/options from Customizer with Polylang
Translate strings from Customizer using Polylang
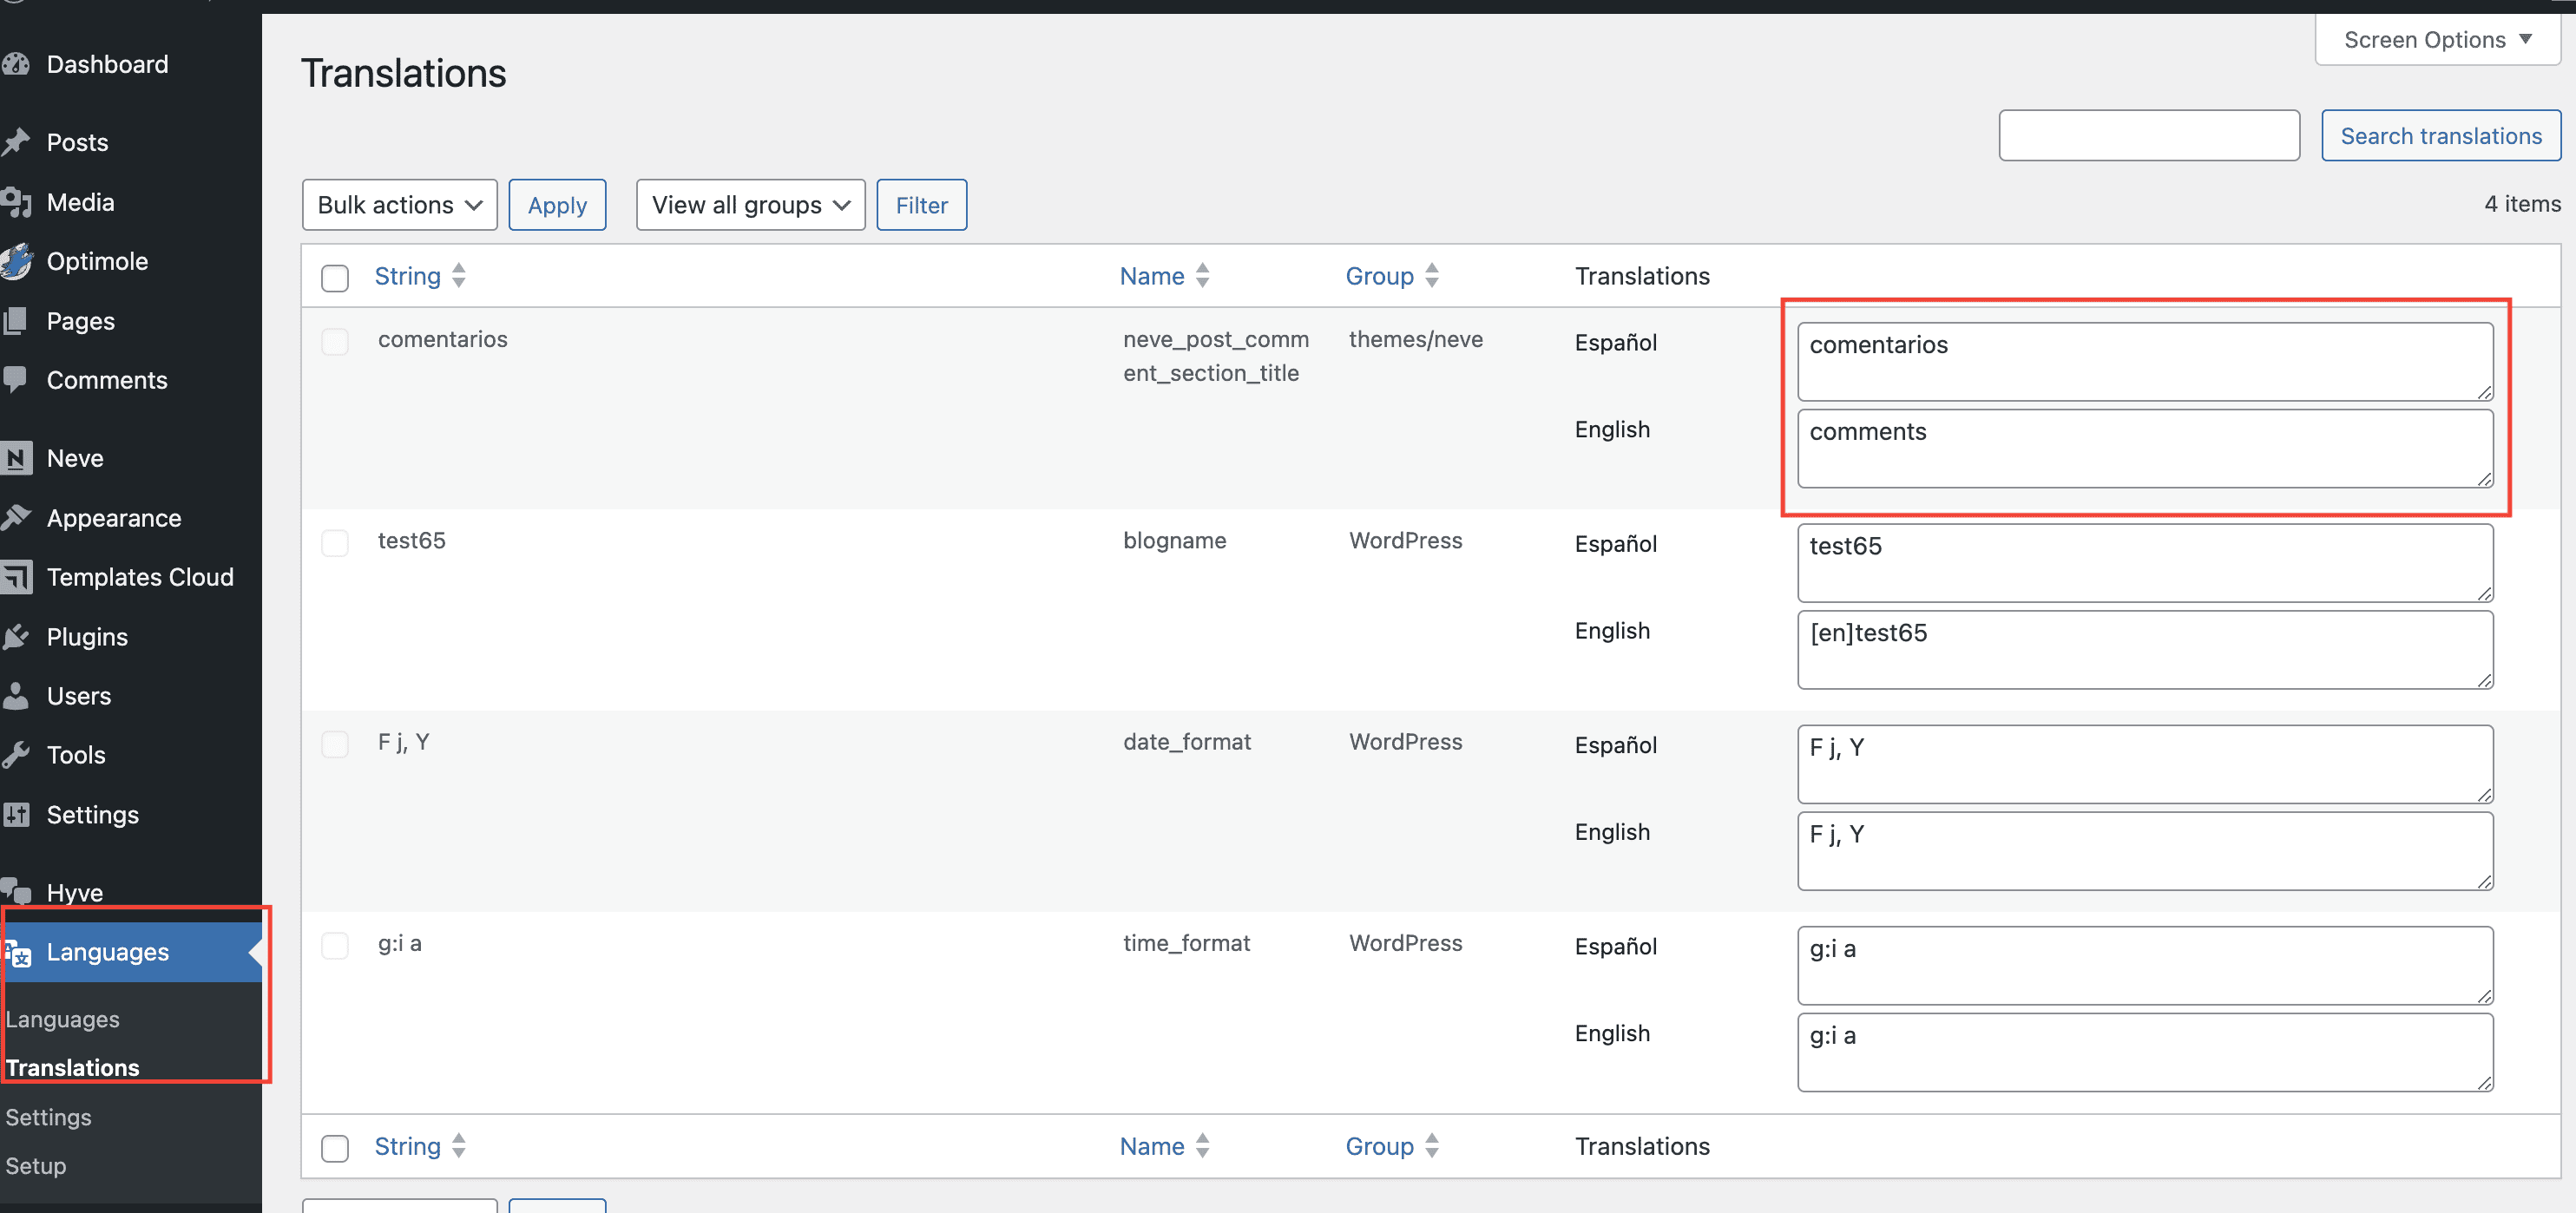
All options from Appearance > Customize can be translated by going to Dashboard > Languages > Translations.
Note: If a string is missing, it's possible that the option is using the default value. To fix it, make sure you locate the option in Appearance > Customize, change its value and publish the changes.
Note for Hestia PRO: In the case where the homepage is set to be a Static Page, you also need to make sure that that page has an equivalent page for each language of the site.
Here is where you can translate options that are just text, but also other options, like images or shortcodes.
Here are a few examples with Polylang
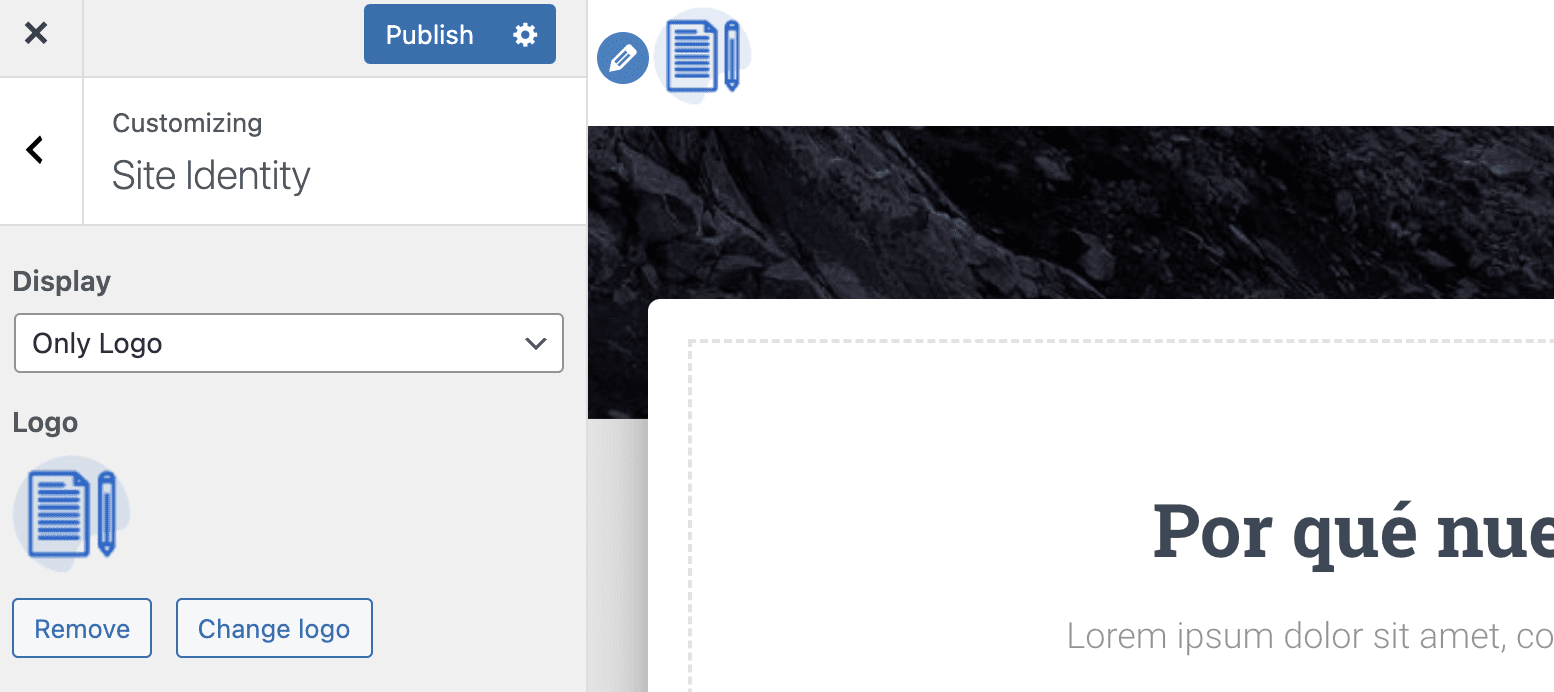
1. "Translate" the Logo option from Hestia PRO
- Upload the logo in Dashboard > Appearance > Customize. This will be the logo displayed for the default language of the site.
- Go to Dashboard > Languages > Translations. Locate the custom_logo option. You will notice there the ID of the media file uploaded for the logo.
- To add the logo that will be displayed for the second language of the site, go to Dashboard > Media > Library and click on the "Add New Media File" button to upload the new image.
- Locate the ID of the new image, from its URL.
- Go to Dashboard > Languages > Translations and add the new ID. Save the changes.
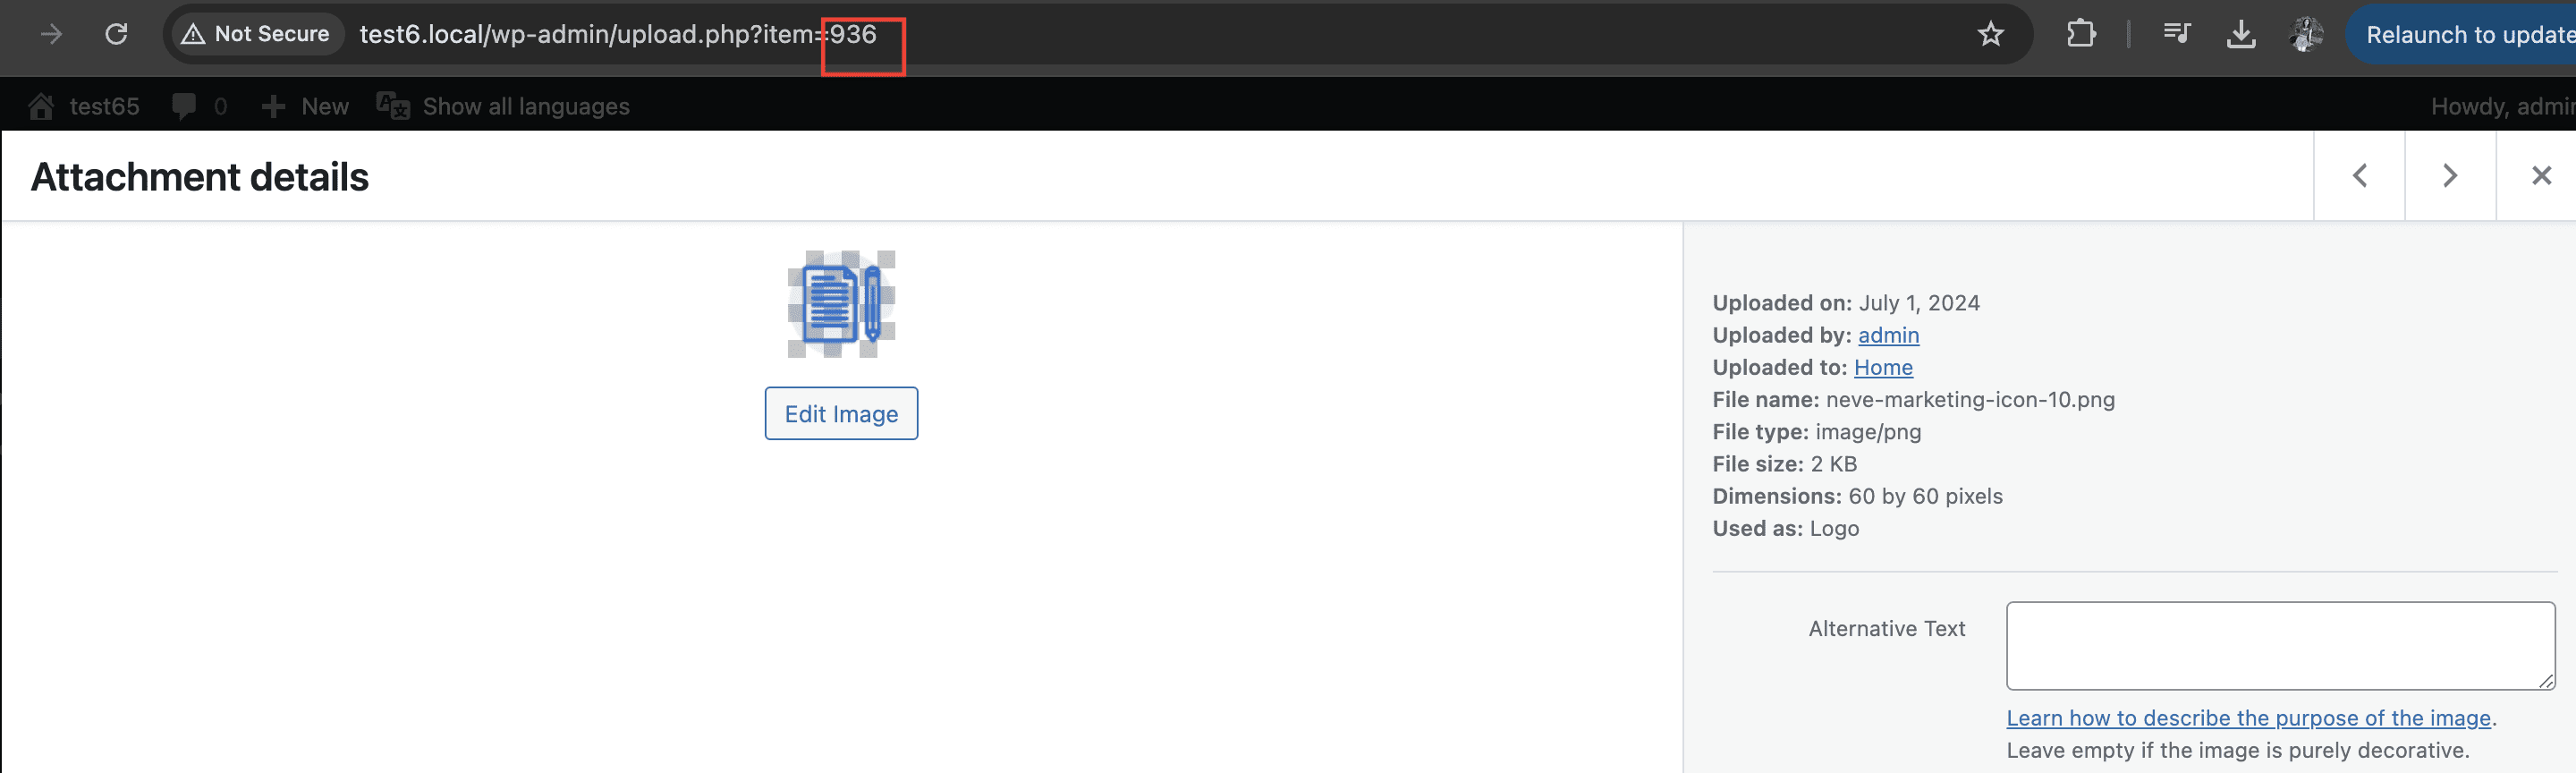
Get the attachment ID
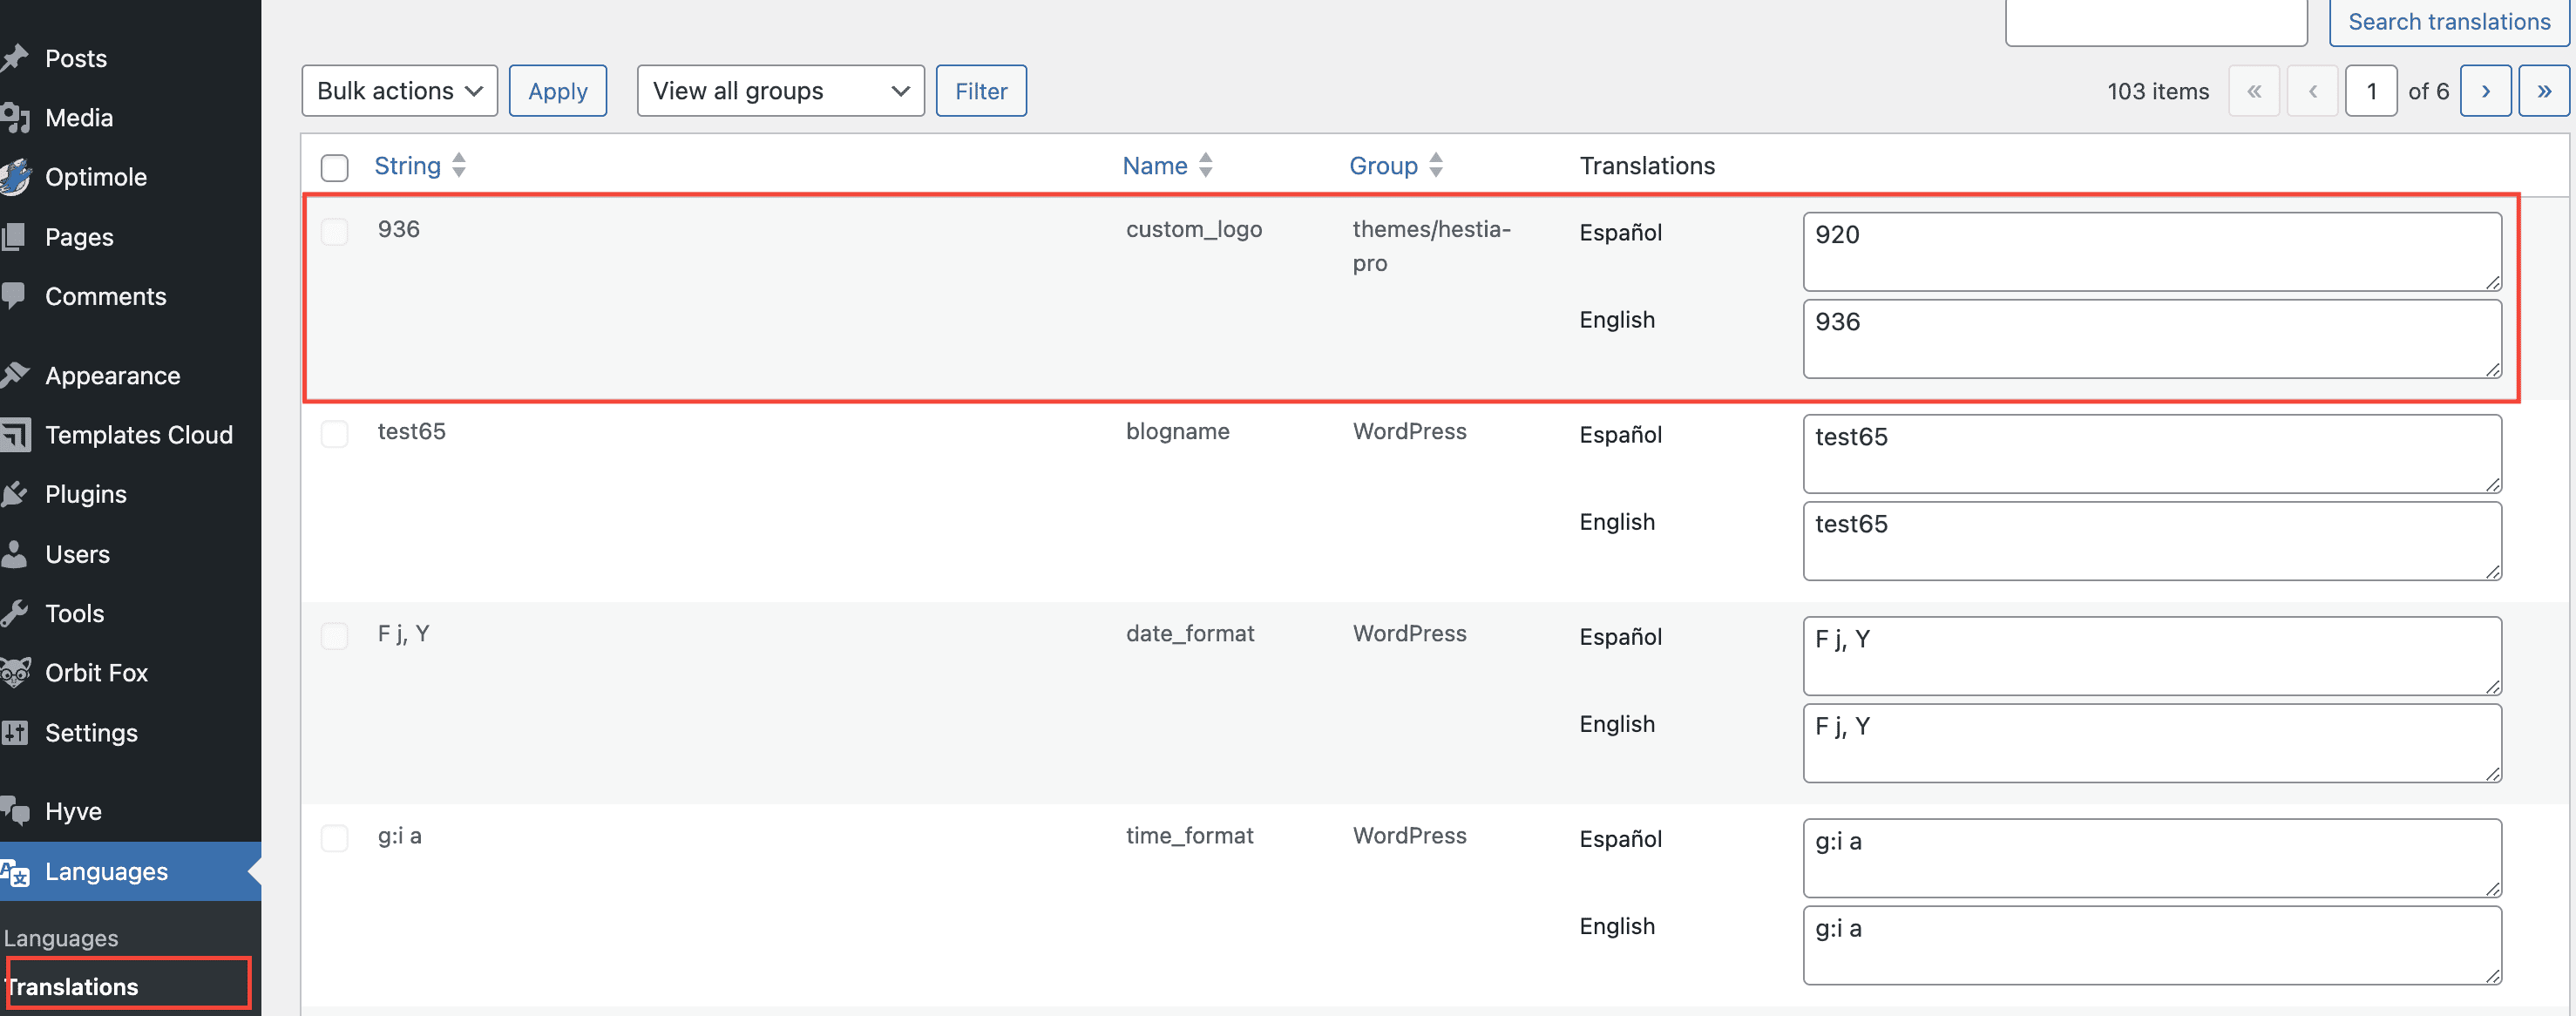
Translate Hestia PRO's logo in Polylang
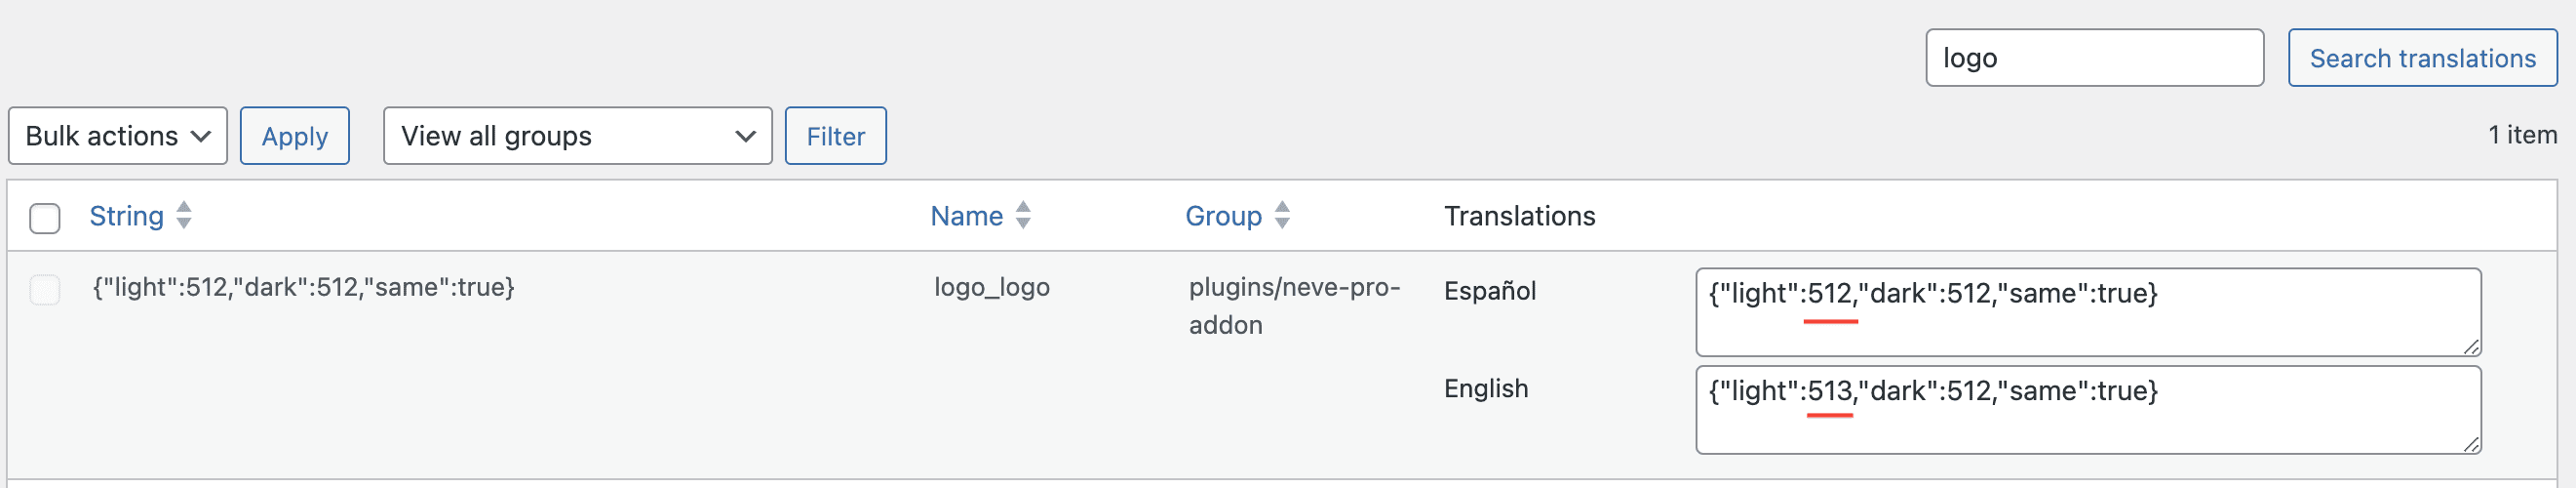
2. "Translate" the Logo option from Neve PRO
The same principles can be applied when using Neve PRO.
Search for the logo option in Dashboard > Languages > Translations and use the ID of the new uploaded image in the corresponding language field. The difference consists of the format of the option. For Hestia PRO, it was just the ID of the image, while for Neve PRO, there is a JSON with various other options.
3. "Translate" the Frontpage Contact form in Hestia PRO
- in Dashboard > Appearance > Customize add the shortcode of the Contact form you want to have displayed for the default language of the site.
- Create a different Contact form for the second language of the site.
- Go to Dashboard > Languages > Translations and add the new shortcode.
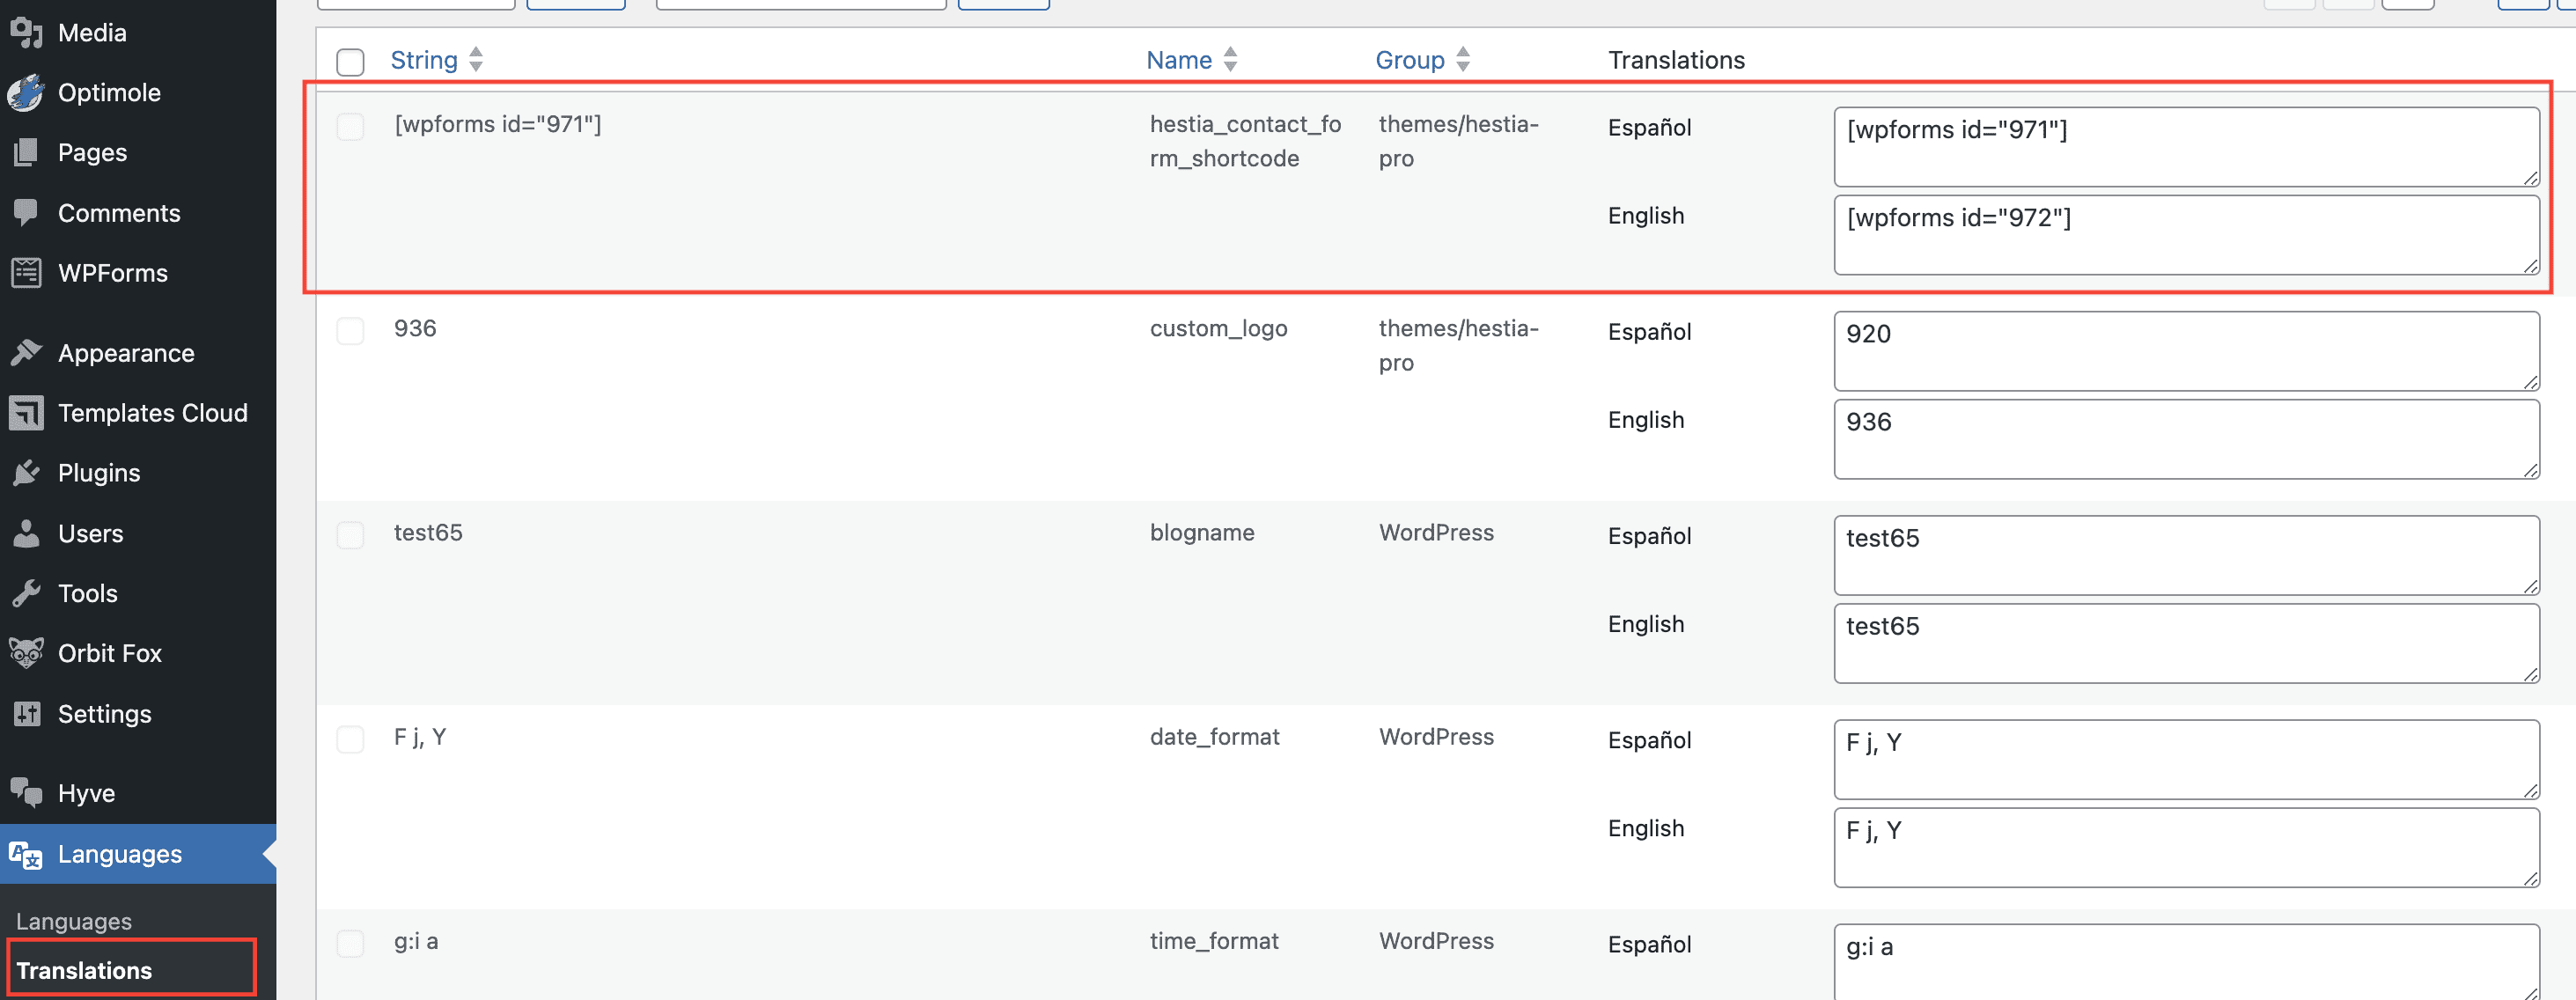
Translate shortcodes in Polylang
4. Enable/Disable specific frontpage sections, based on the language, in Hestia PRO
In Hestia Pro, each frontpage section has an option to be disabled or not.
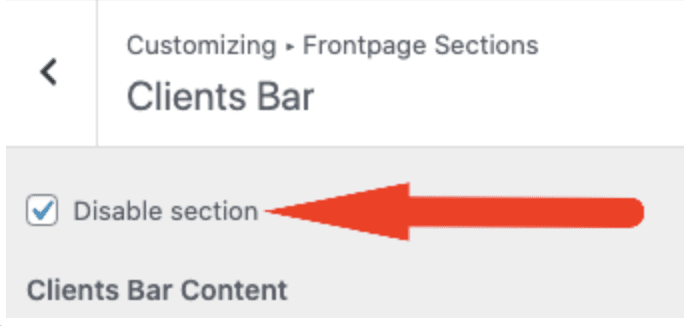
To have some of the sections enabled in just some of the languages of the site, you first need to use a child theme, with this wpml-config.xml file in the root of the child theme folder. ( Make sure to replace theme_mods_hestia-pro-child with the correct name of your child theme folder ). For more details on child themes, follow Section 4. Using Polylang with a child theme.
After that, you can navigate to Dashboard > Languages > Translations and look for the options to disable each frontpage section. You can use 1 or 0 to disable or enable each section for a specific language.

Enable/Disable specific frontpage sections, based on the language, in Hestia PRO
4. Using Polylang with a child theme
The following step is required when using a child theme of one of our themes.
Locate and copy the wpml-config.xml file from the parent theme folder(it's located in the root folder) into the child theme folder.
At the beginning of the file, you will see a line similar to this (in this case, we have Hestia PRO as the parent theme):
<key name='theme_mods_hestia-pro'>Update the theme name, with the child theme name folder. For example:
<key name='theme_mods_orfeo-pro'>Save the file. At this point, all the previous steps should function as normal.
Note: When using a child theme with Neve and it's premium version Neve PRO, you need to take an extra step of copying these type of lines from the wpml-config.xml file from Neve PRO, to the wpml-config.xml file of your child theme:
<key name="header_palette_switch_placeholder"/>Translate with WPML
1. Setup the WPML plugin
For this part (plus, for creating menus and widgets for each language of your site), we recommend you follow the official recommendations from WPML. After installing and activating WPML, go to WPML > Setup to complete a quick setup wizard.
2. Translate posts and pages with WPML
Note: The process is similar to the one in Polylang.
To translate posts and pages with WPML, go to WPML > Translation Dashboard. There, scroll down to expand the sections and select the items you want to translate.
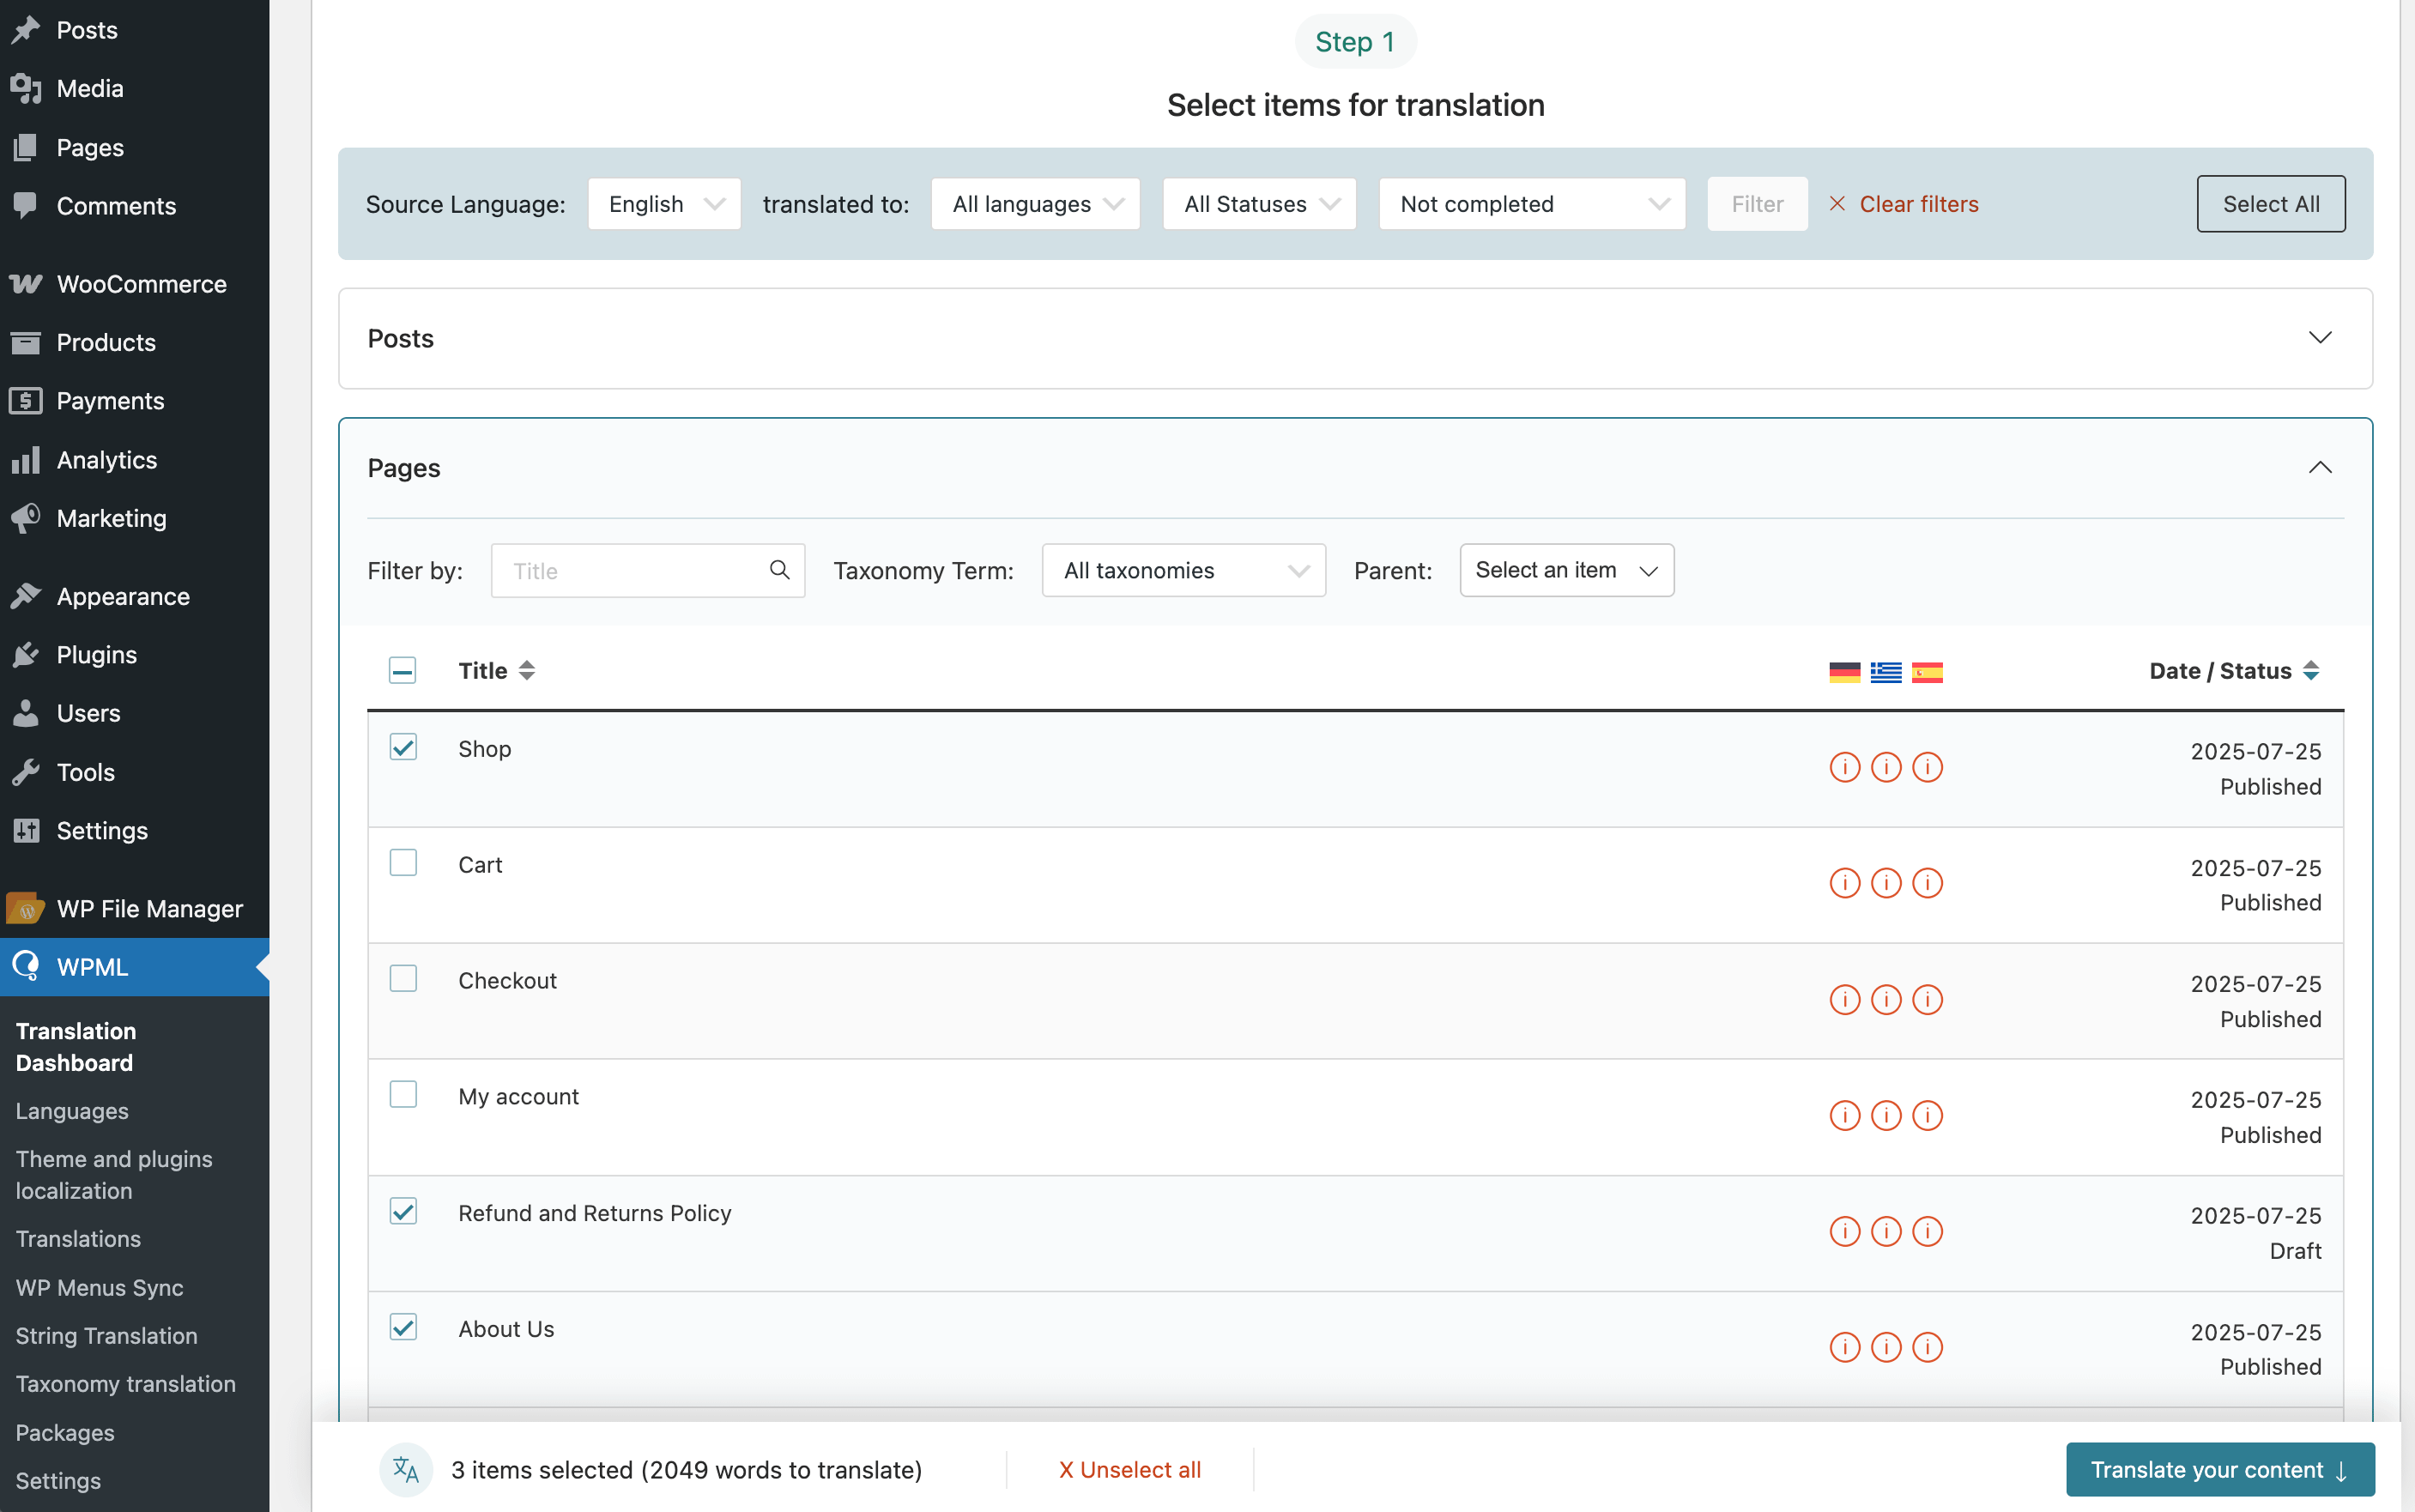
Translate Posts & Pages with WPML
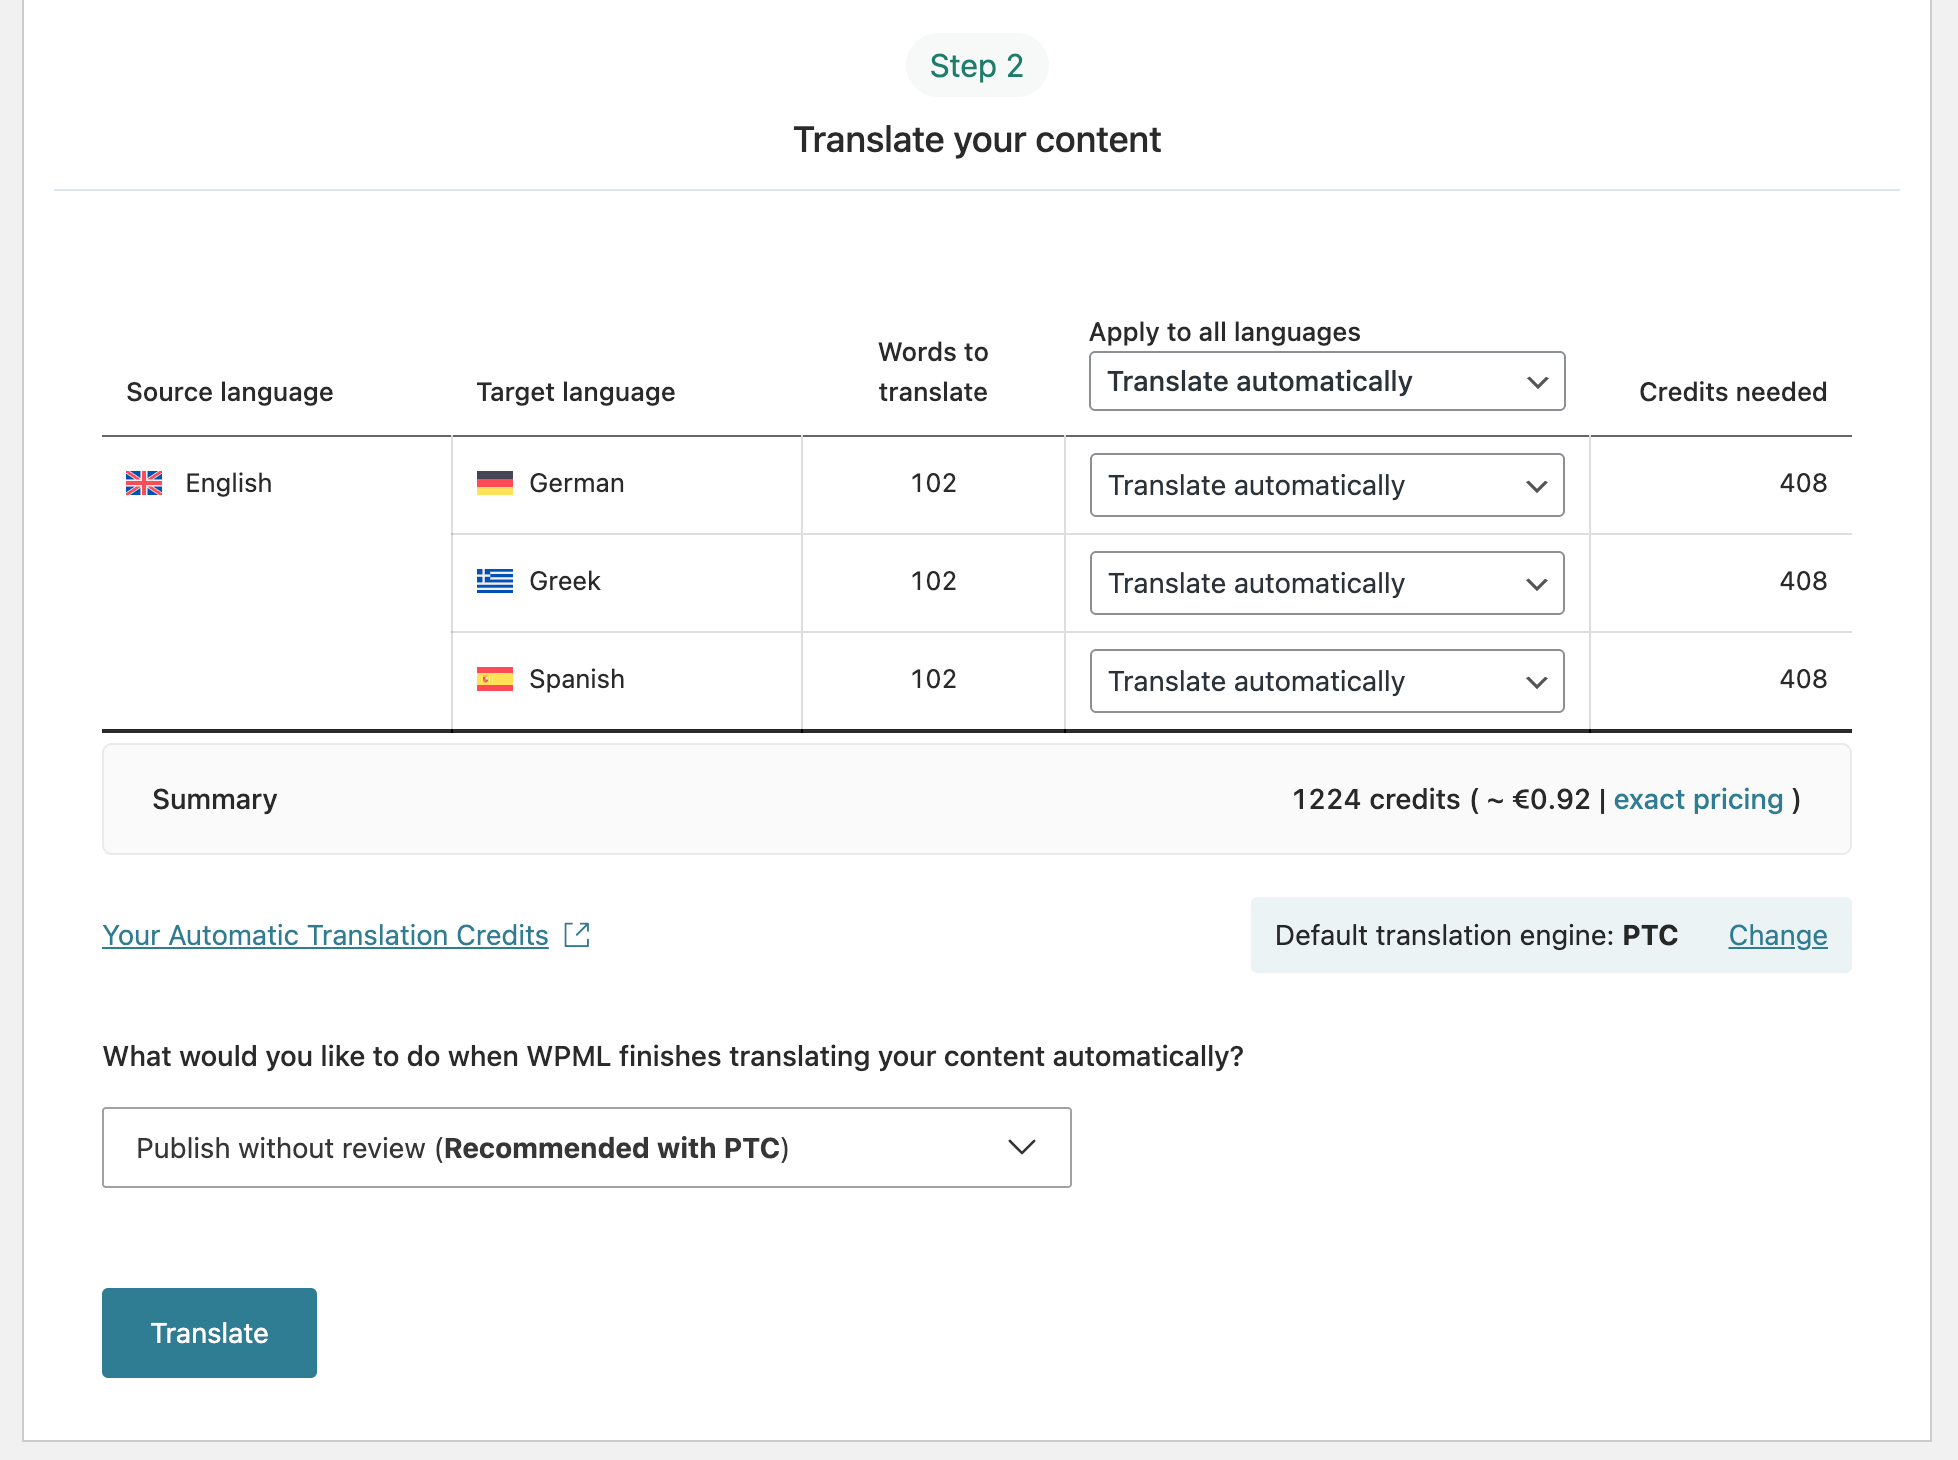
Scroll down to Step 2 to choose a translation method.
For the best translation quality, we recommend Private Translation Cloud (PTC), WPML’s AI translation engine. According to WPML, their AI analyzes your site context to deliver highly accurate translations.
Before sending content for automatic translation, check how many credits you’ll spend and their cost, and click Translate.
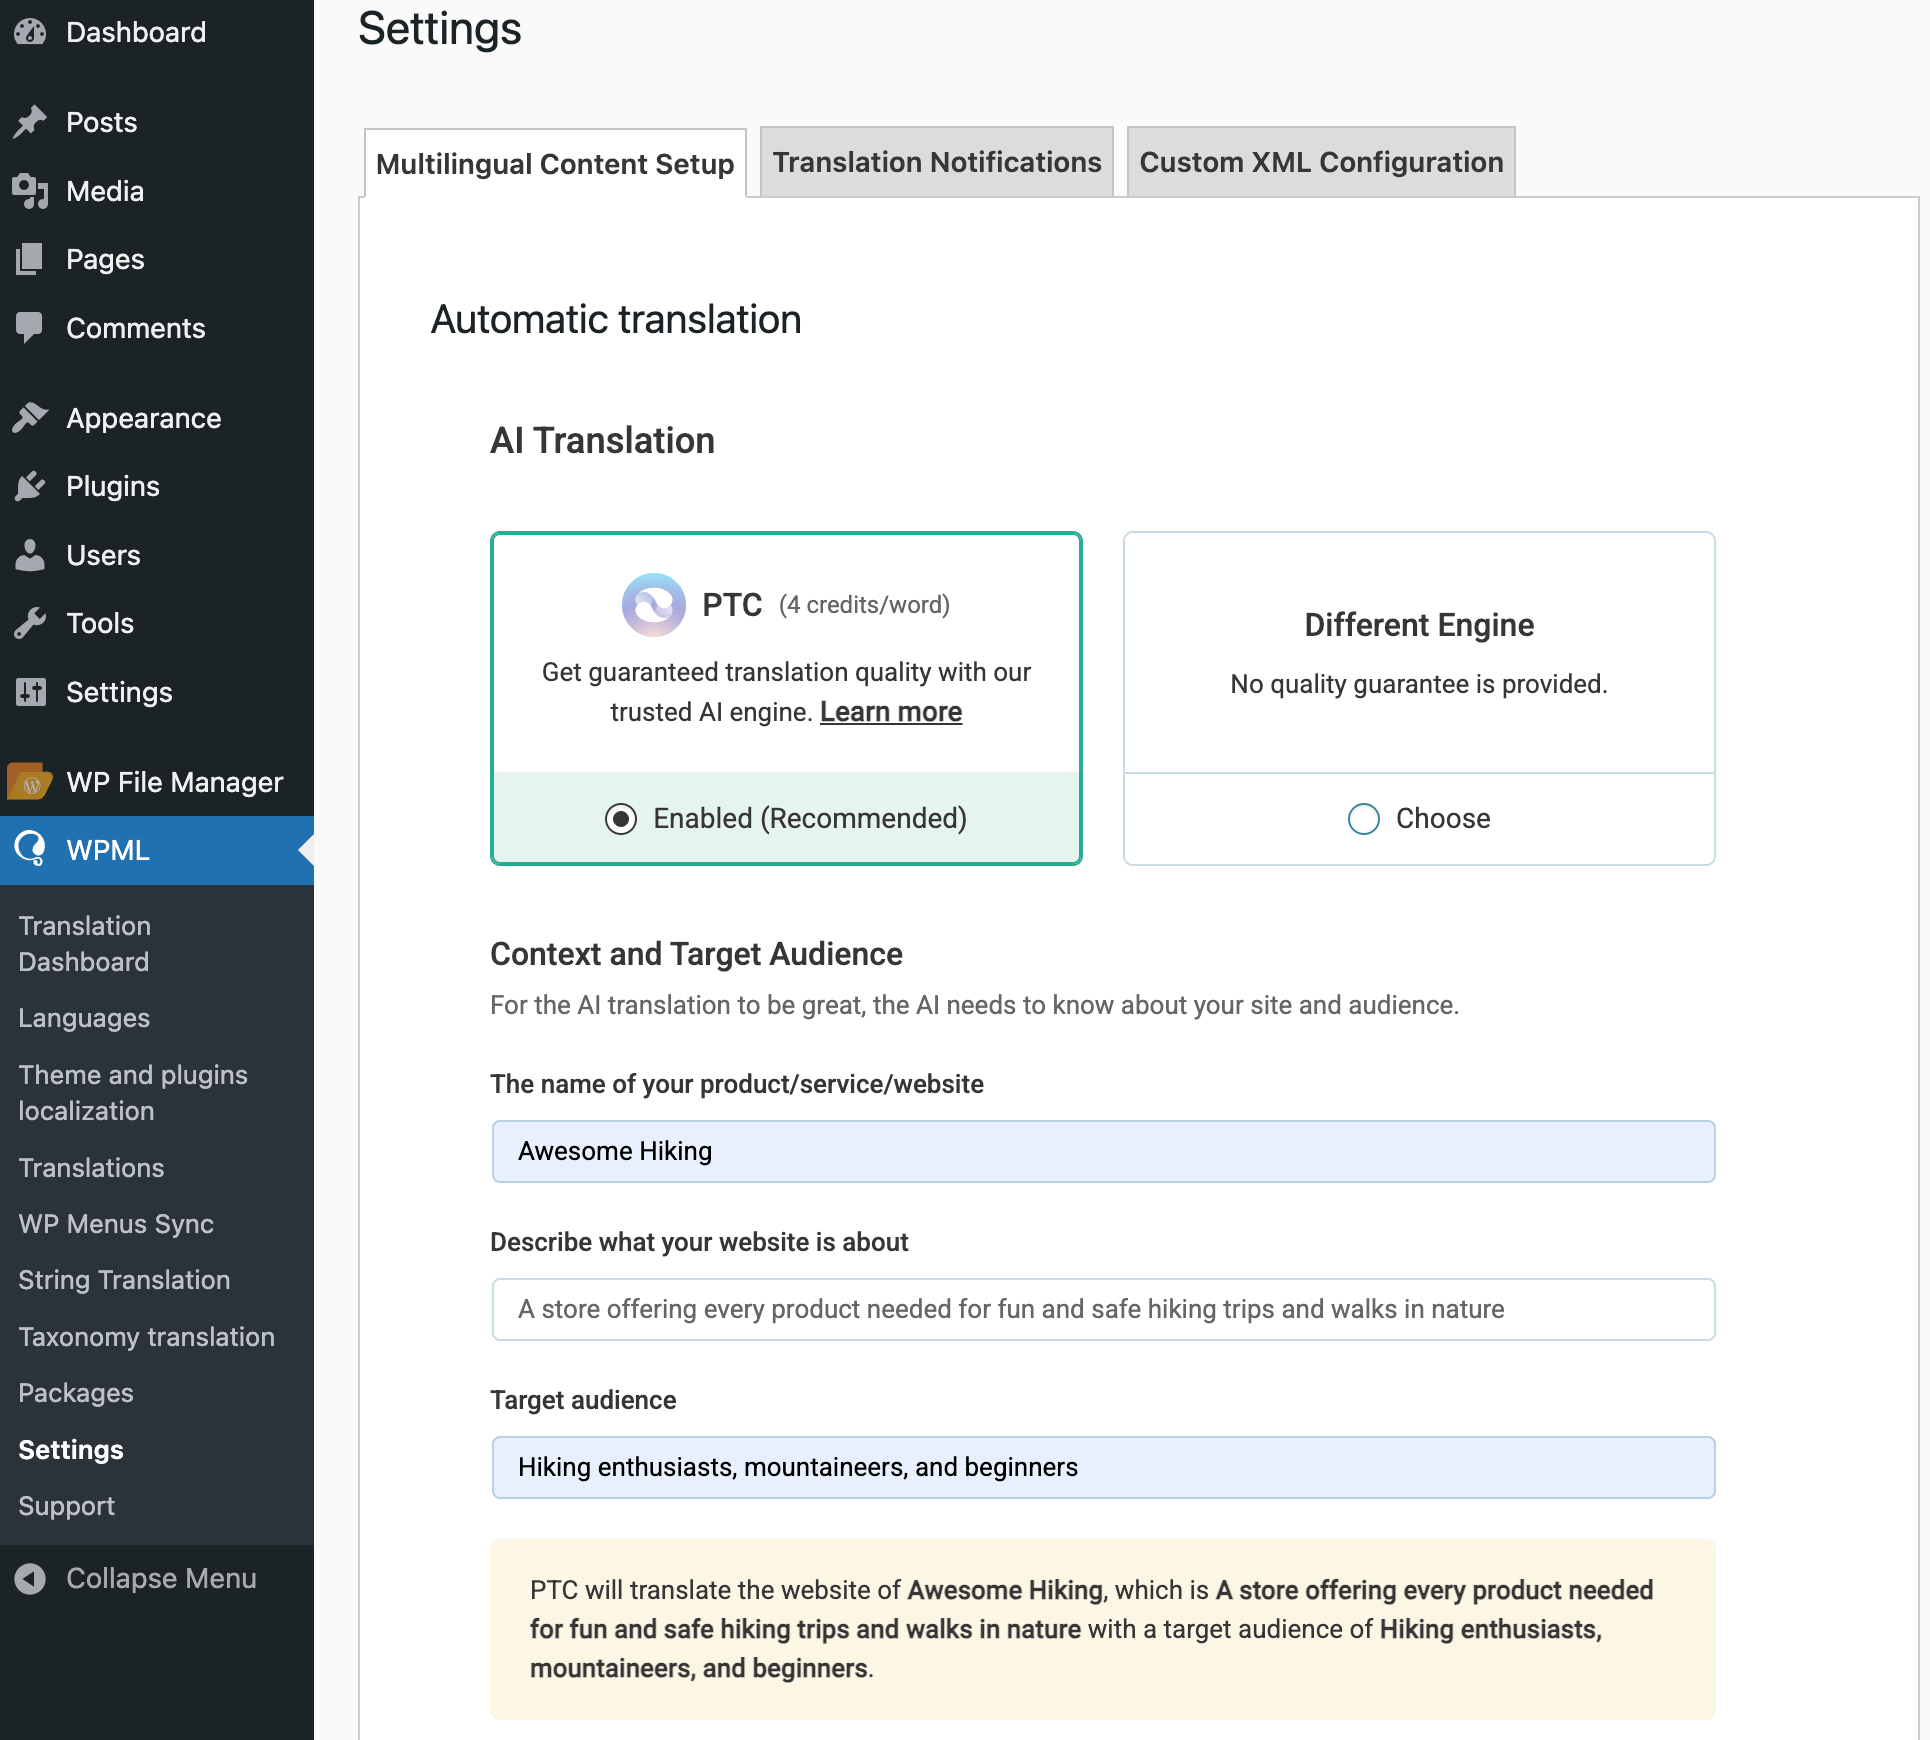
PTC is the default engine for new sites. If you’re currently using a different engine, go to WPML > Settings, select PTC under the AI translation section, and add your site context.
Important note: Some of our themes like Hestia Pro, Zelle Pro, and ShopIsle Pro have their frontpage built using options from Customizer. In these cases, to translate the frontpage, follow the steps from the next section.
3. Translate theme built-in sections/options from Customizer with WPML
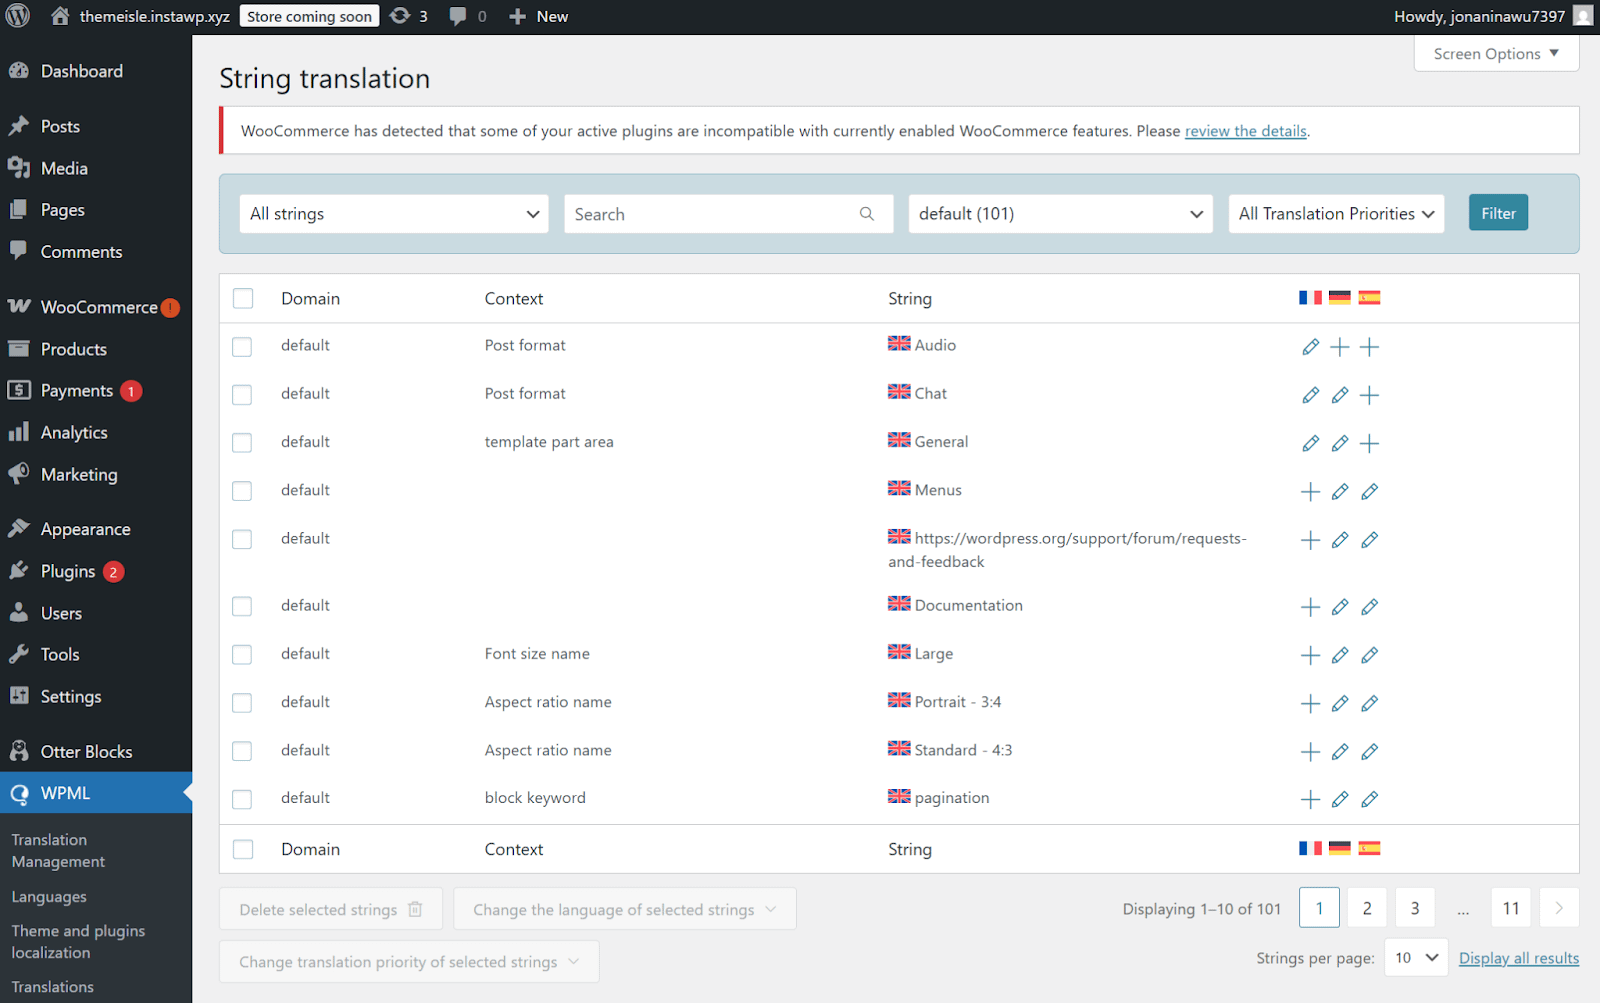
All options from Appearance > Customize can be translated by going to Dashboard > WPML > String Translations.
 .
.
WPML String Translation Interface
Important notice: To have access to the String Translations module from WPML please refer to the WPML official documentation as the module requires a specific type of subscription.
Note: If a string is missing, it's possible that the option is using the default value. To fix it, make sure you locate the option in Appearance > Customize, change its value and publish the changes.
Note for Hestia PRO: In the case where the homepage is set to be a Static Page, you also need to make sure that that page has an equivalent page for each language of the site.
Use case: Translate FSE themes with WPML
For full details, we recommend you follow the official recommendations from WPML.
Translating the Site Editor Templates
Site Editor Templates can be found by navigating to Appearance > Editor > Templates.
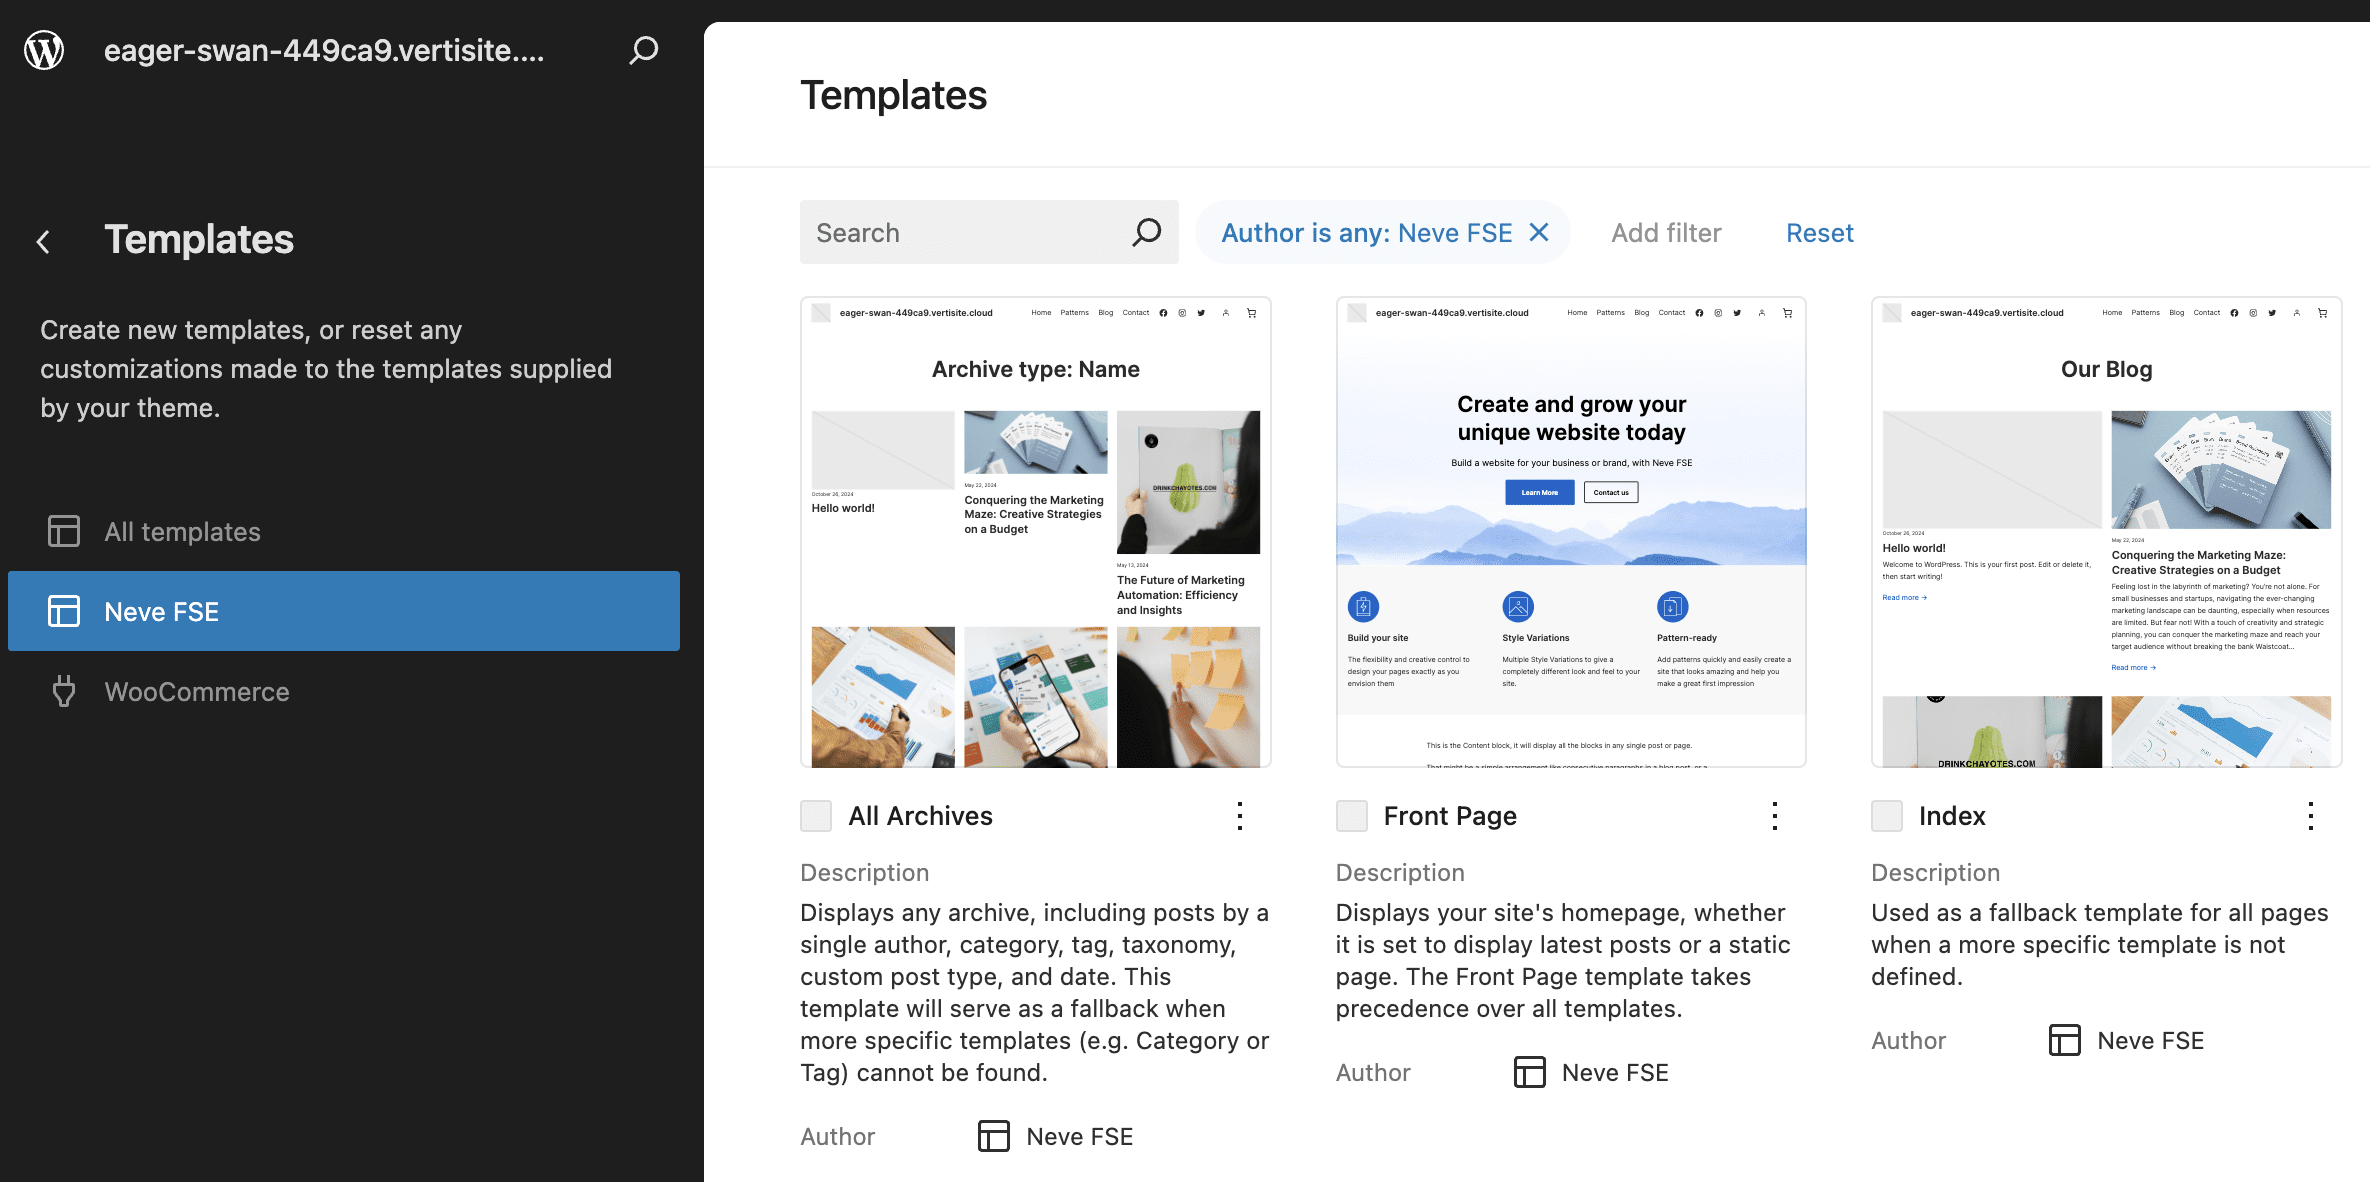
The list of templates shipped with Neve FSE
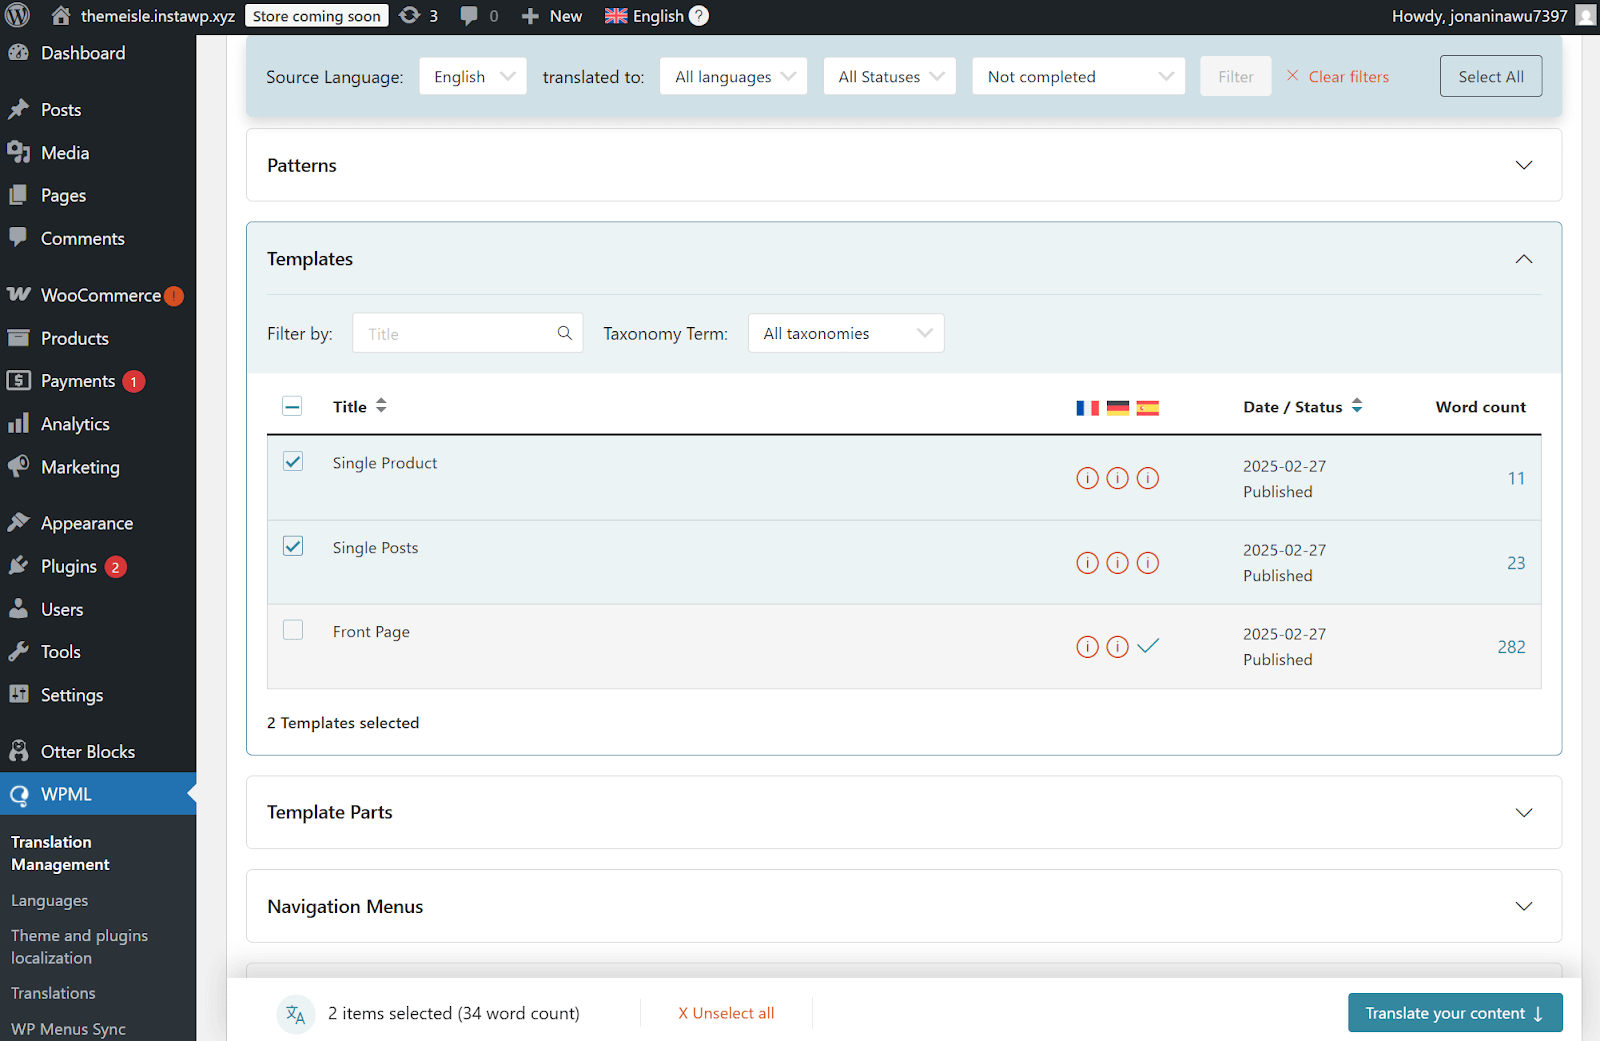
To translate Templates with WPML, you first need to re-save them. To do this, visit your Template inside the Site Editor, make a small change, and click Save.
Your template will now appear in WPML’s Translation Dashboard, and can be translated the same way as pages and posts.
WPML Translation dashboard
Translating Menus in Site Editor Templates
Although the Site Editor lets you add a Navigation block into your Header, your menu items won’t translate along with the template.
To translate menus with WPML, follow these steps:
- Go to Appearance > Menus and click the +{language} link you want to translate your menu into.
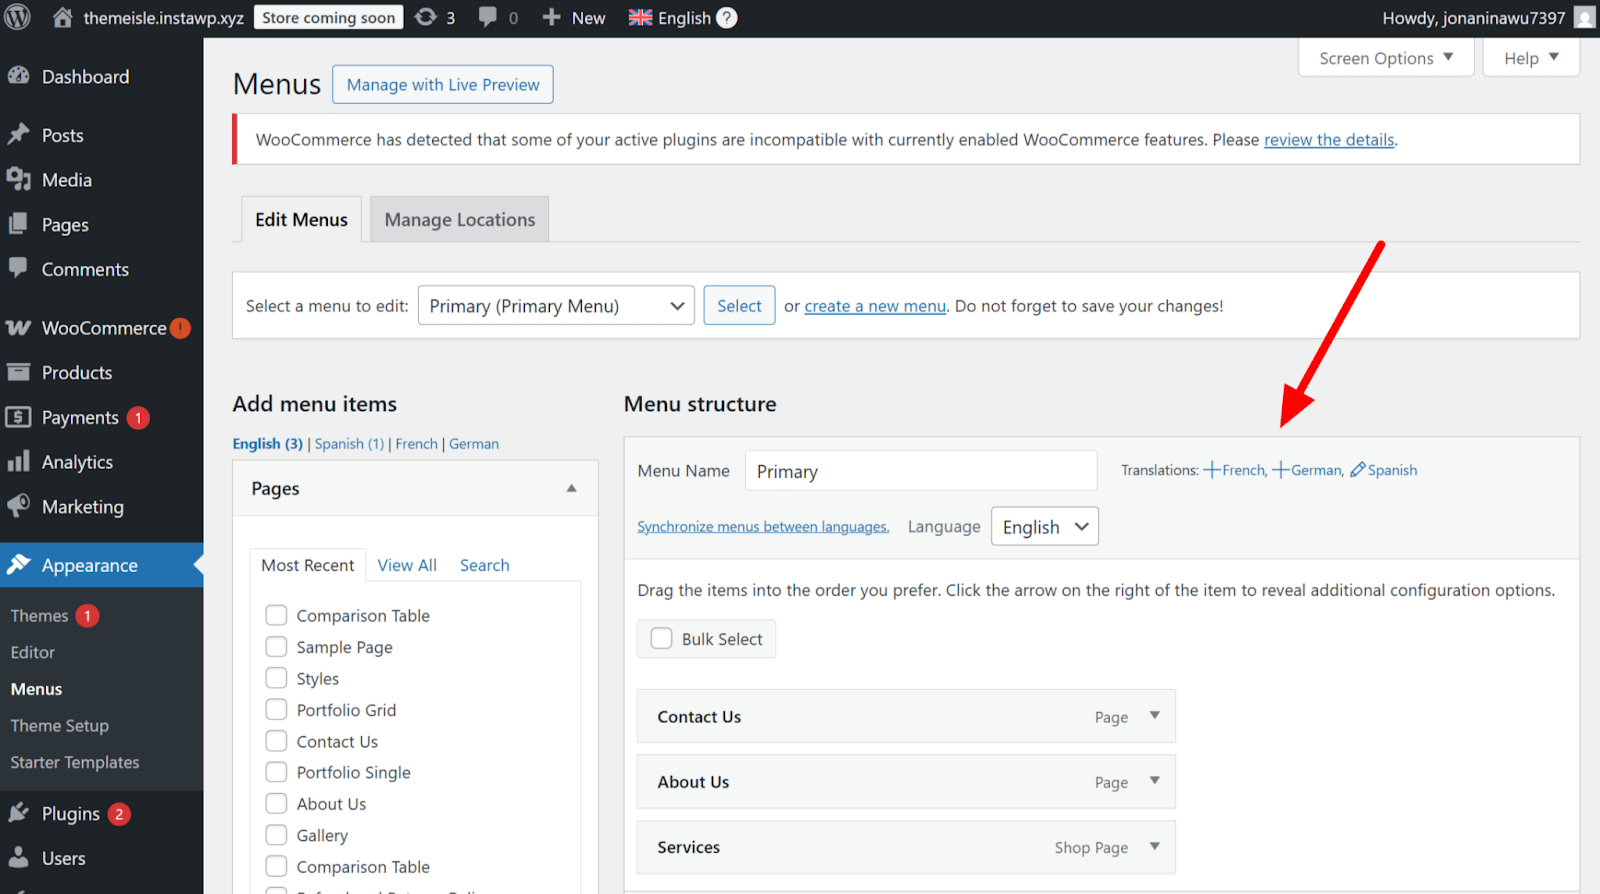
Translating Menus in WPML
- Name your new menu and add the same items you added to your default language menu. Only translated items will appear, so make sure your content is translated.
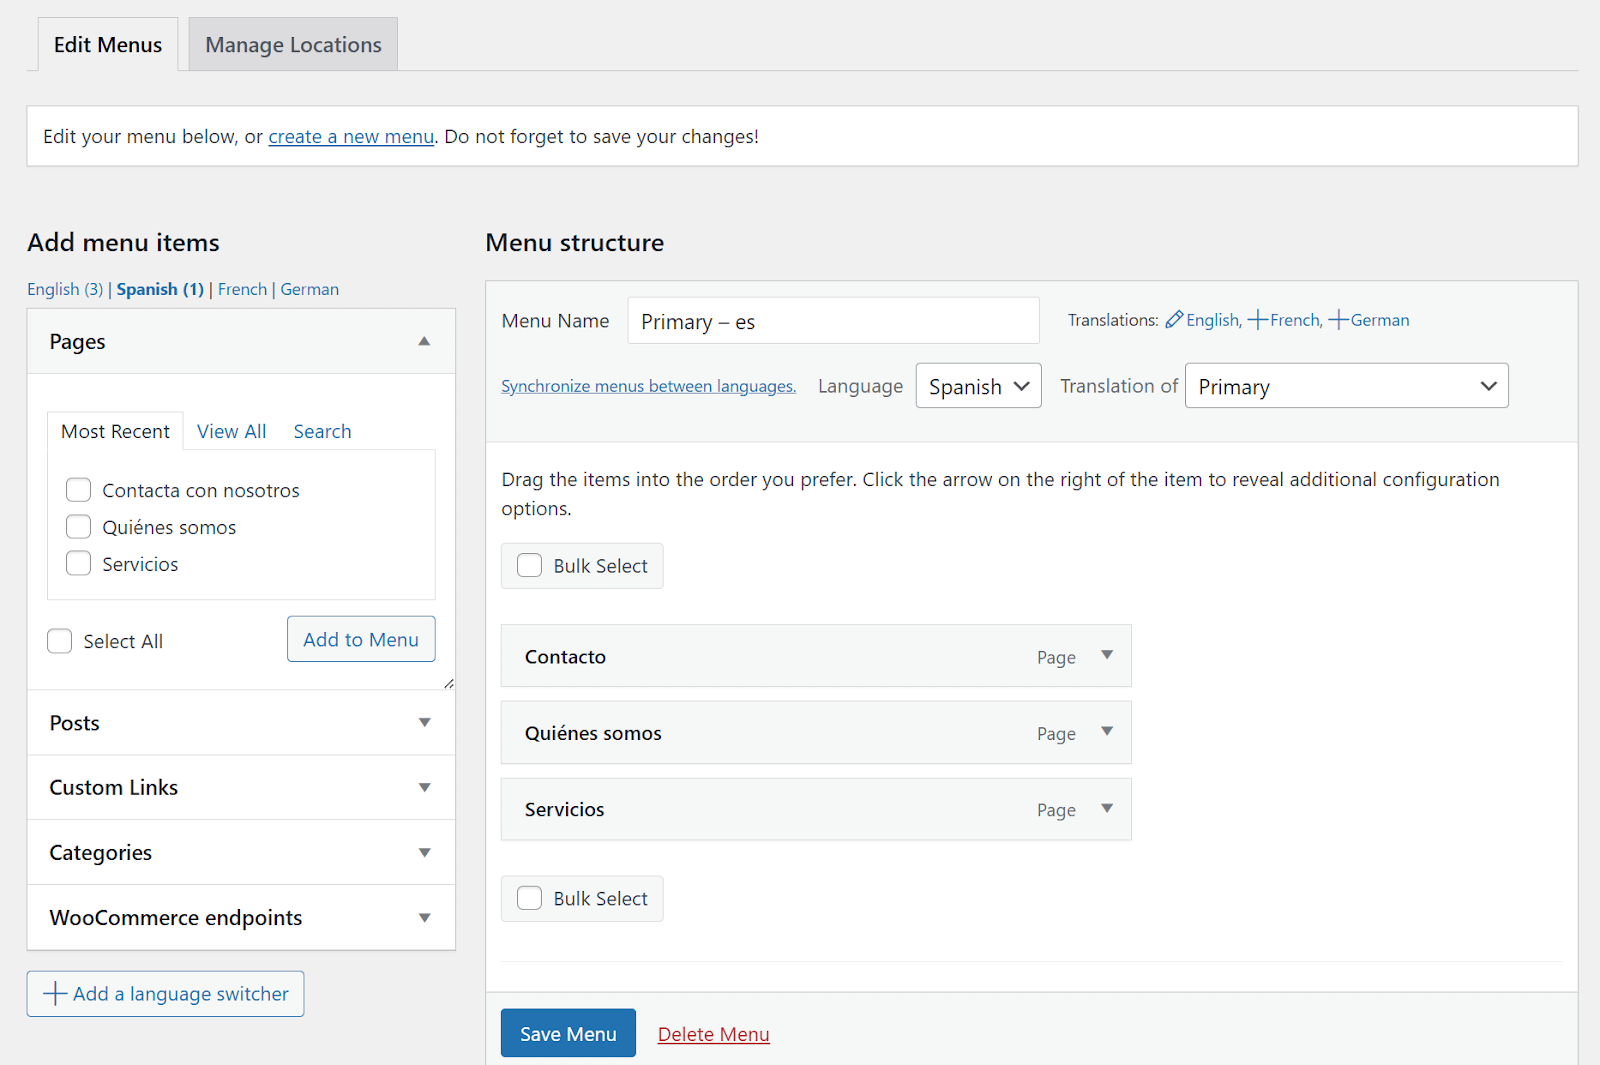
Spanish Menu Translation in WPML
- Once done, go directly to Appearance > Editor and click your Header. Edit the existing navigation block, set it to your translated menu, and click Save.
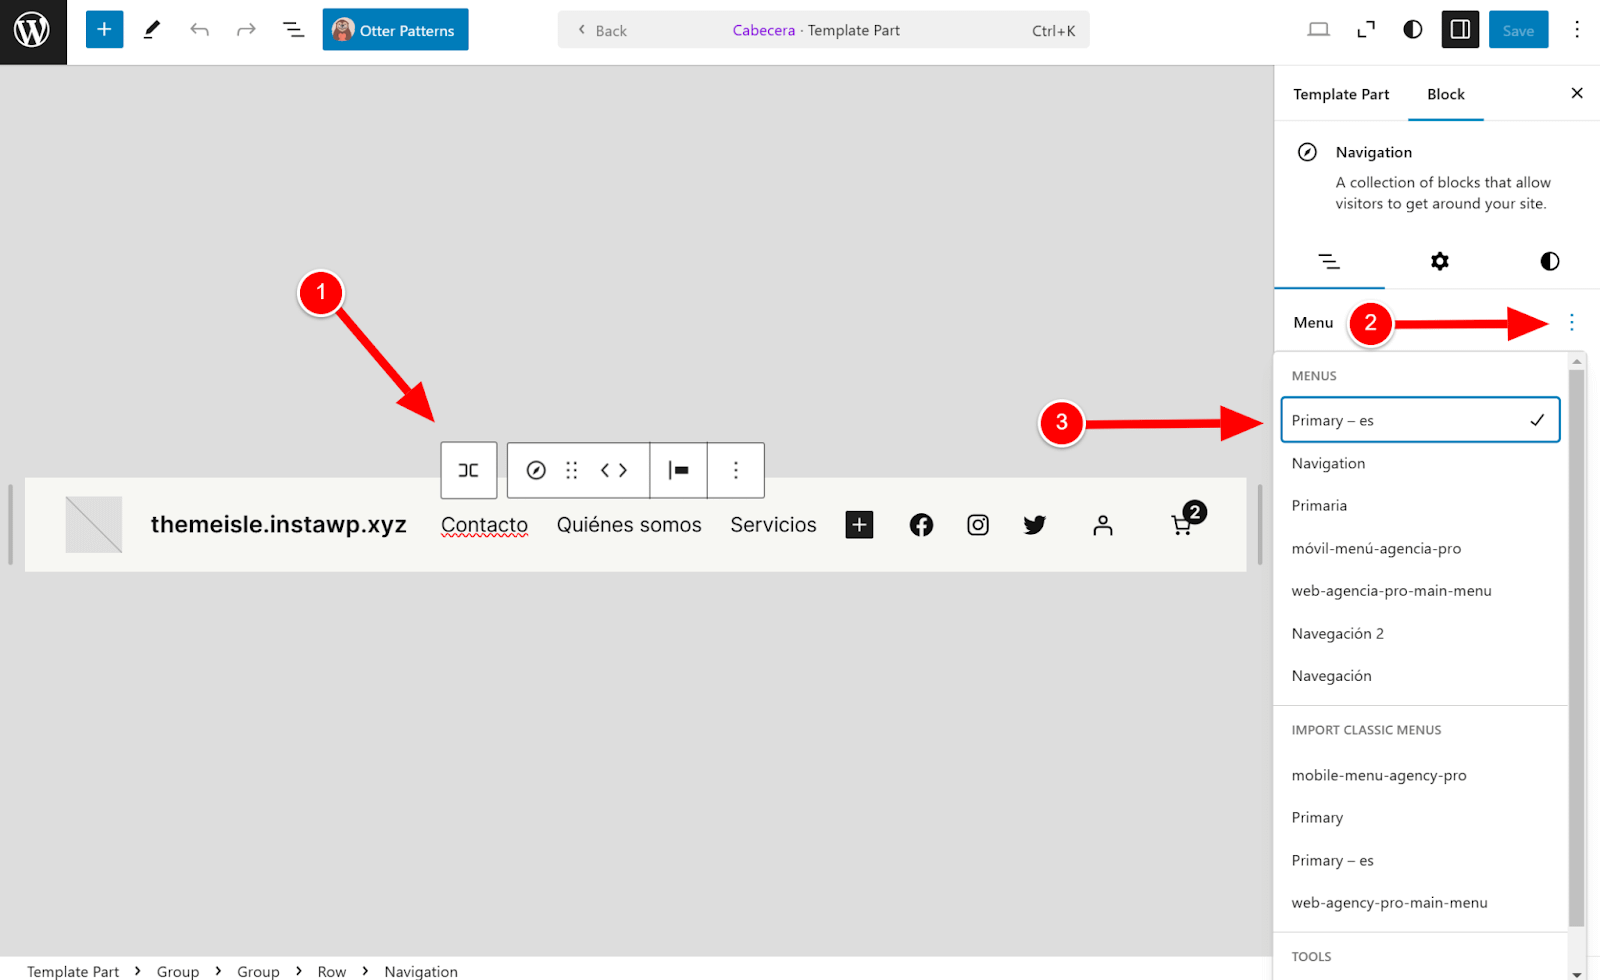
Selecting the Translated Menu in Site Editor
Your navigation menu will now appear translated when switching languages on your site.
Use case: Translate Visualizer PRO charts with WPML
The Visualizer: Charts and Graphs plugin has integrated WPML support. To translate charts created with Visualizer:
1. Navigate to WPML > Settings and scroll until Post Types Translation.
2. Check the Translatable button next to the Visualizer Charts type.
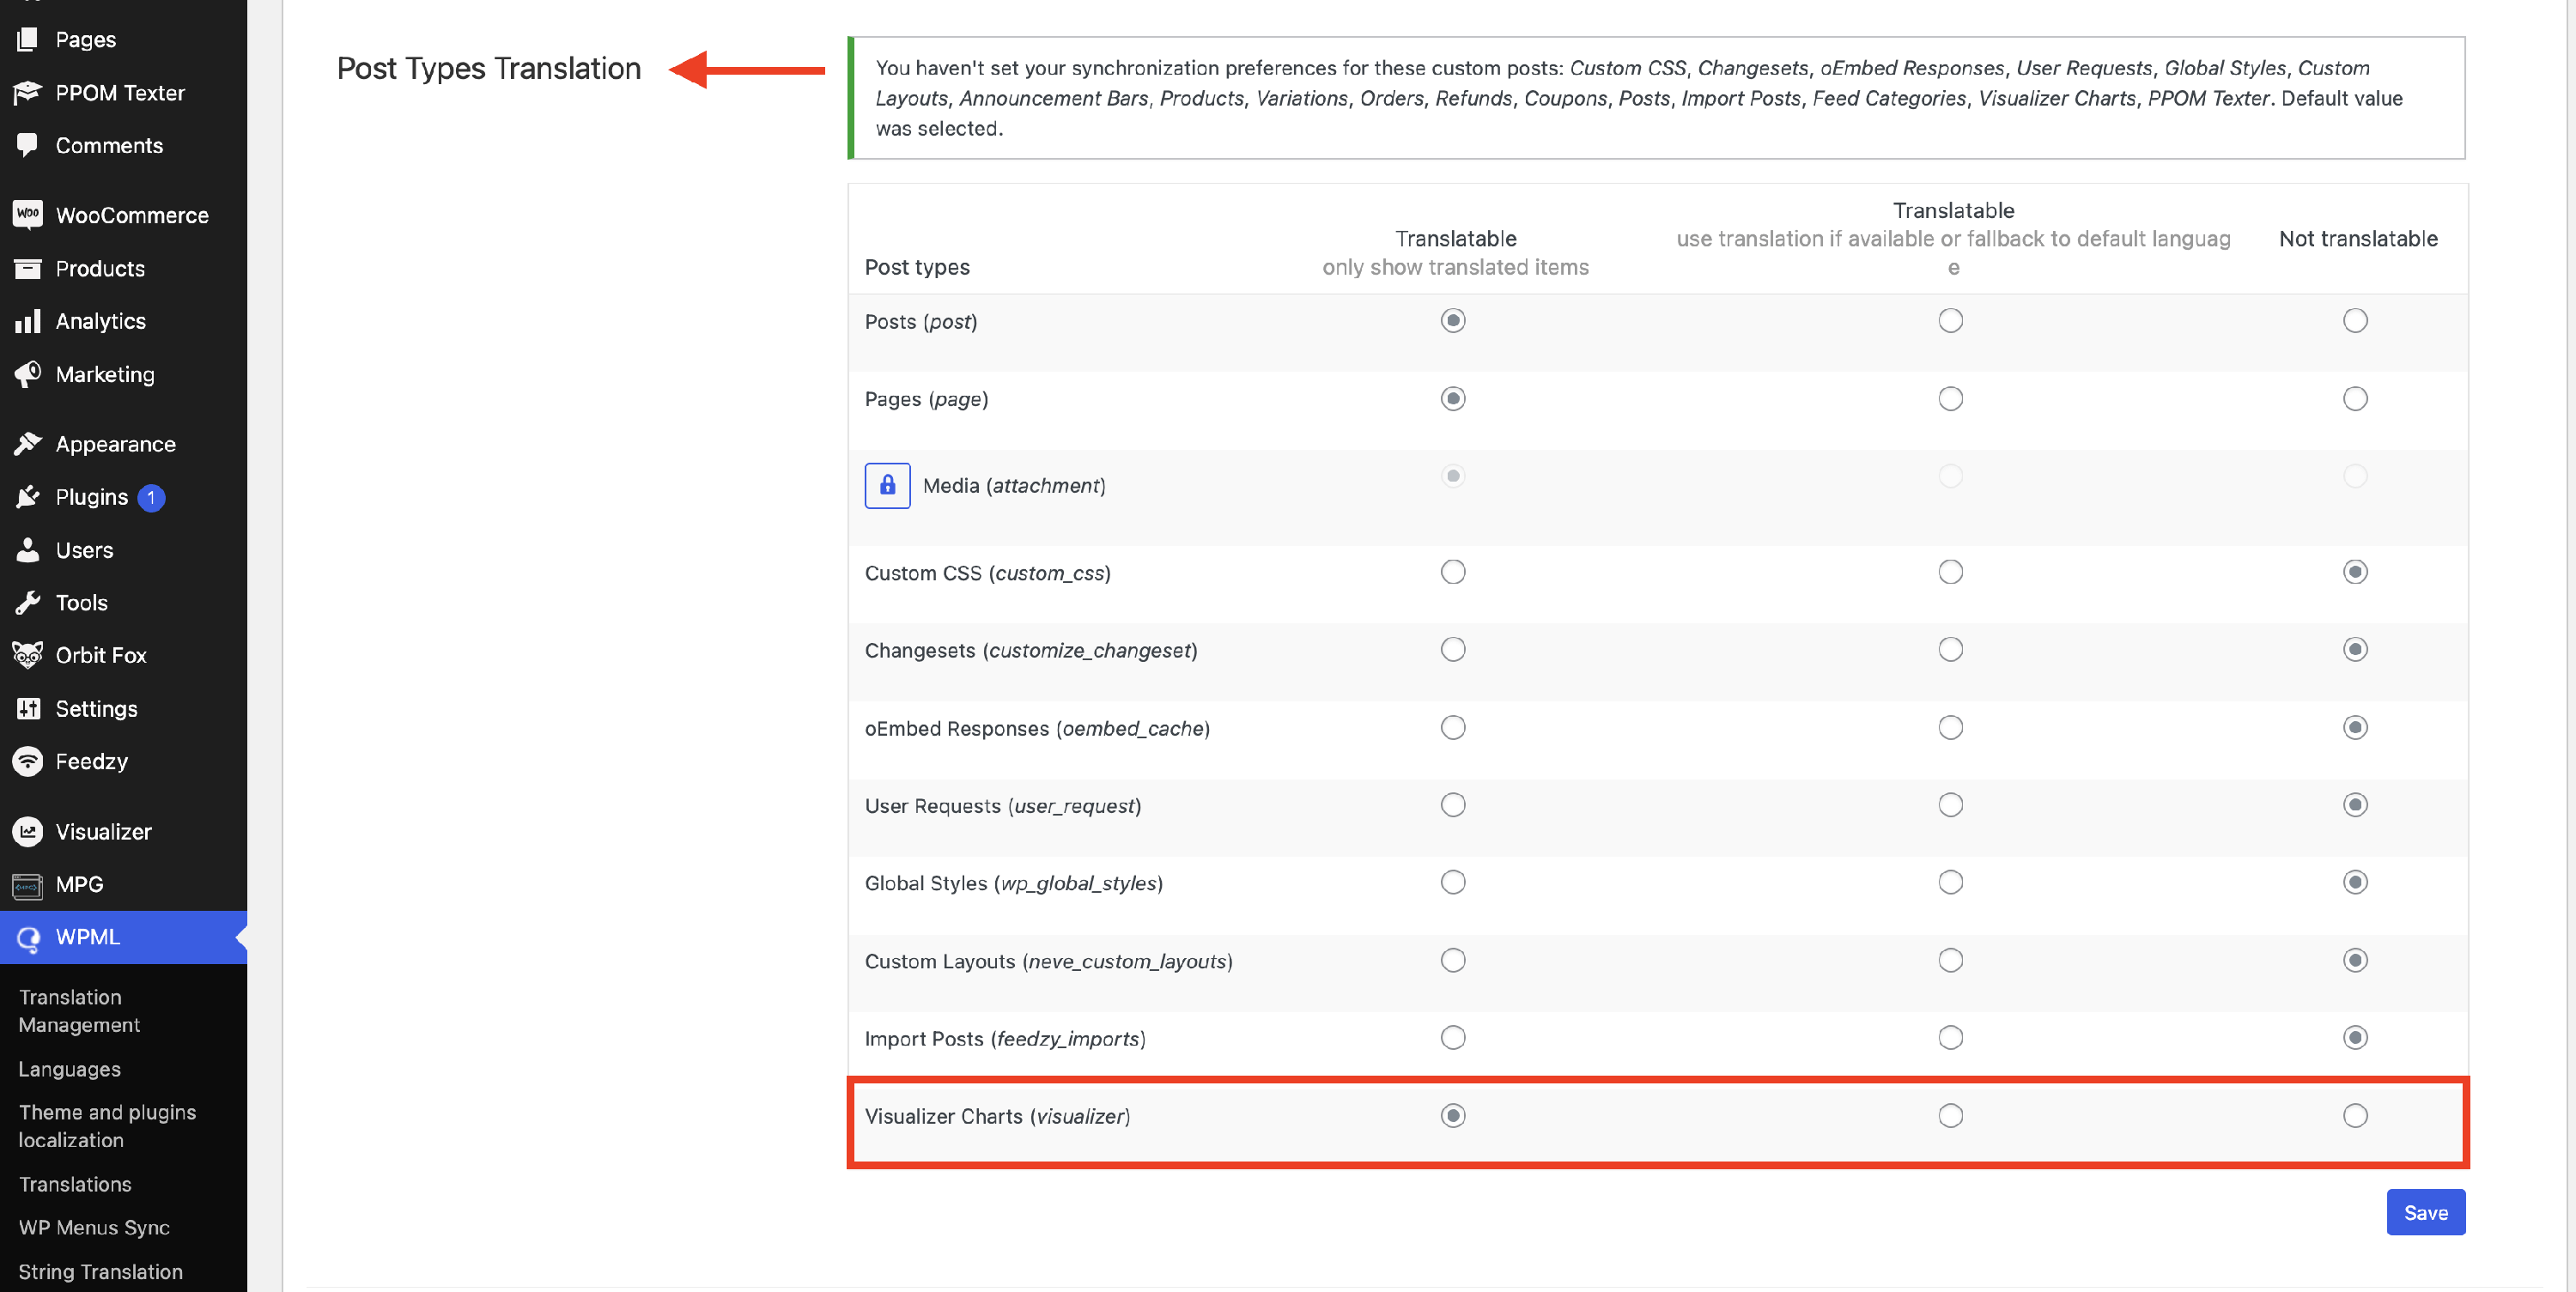
Enable Visualizer Charts as Post Type Translation in WPML
3. Navigate to Visualizer > Charts Library and click on the + button to translate a chart in the other language of your site.
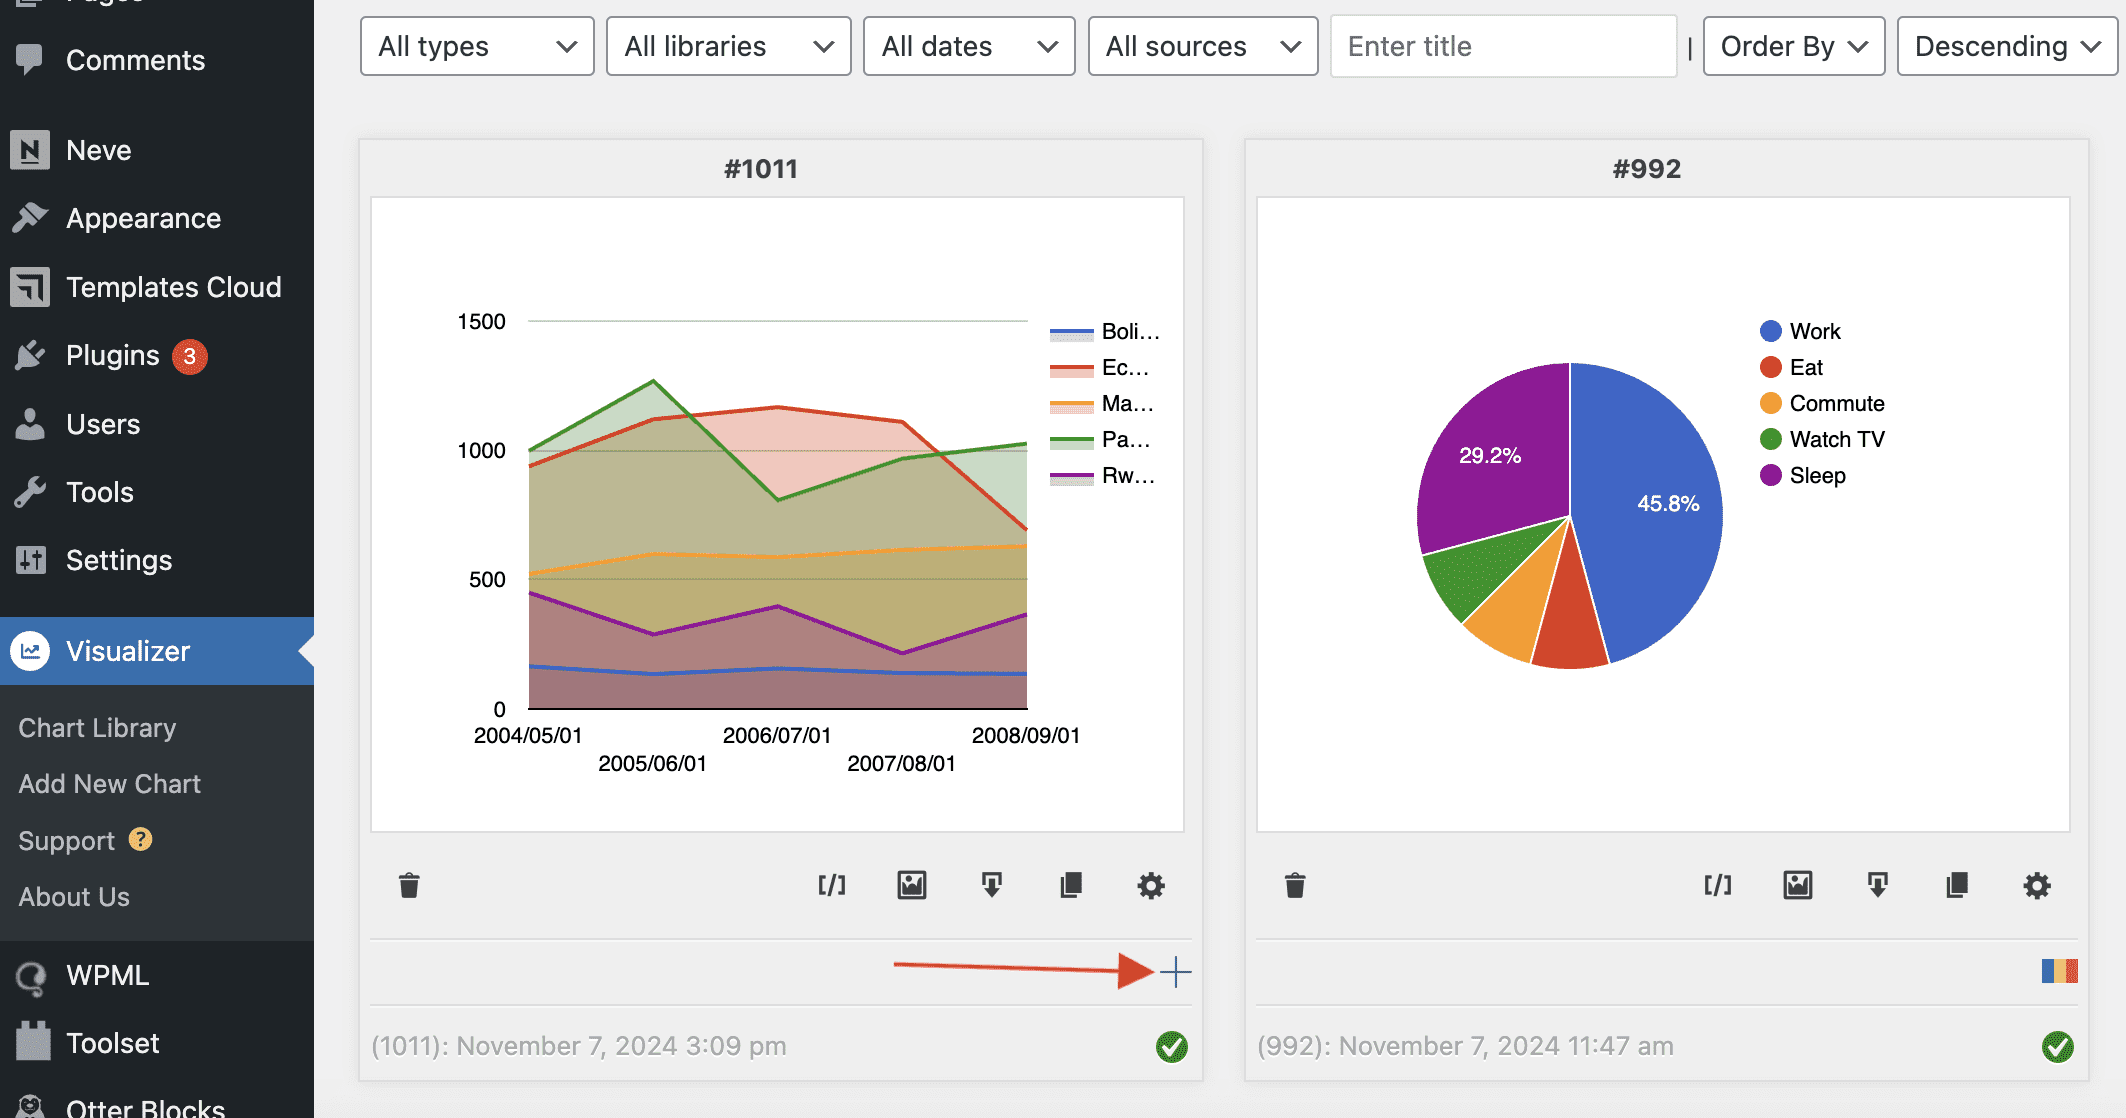
Translate a chart in WPML
4. From the top menu bar, switch the language, or choose All languages to see the corresponding charts.
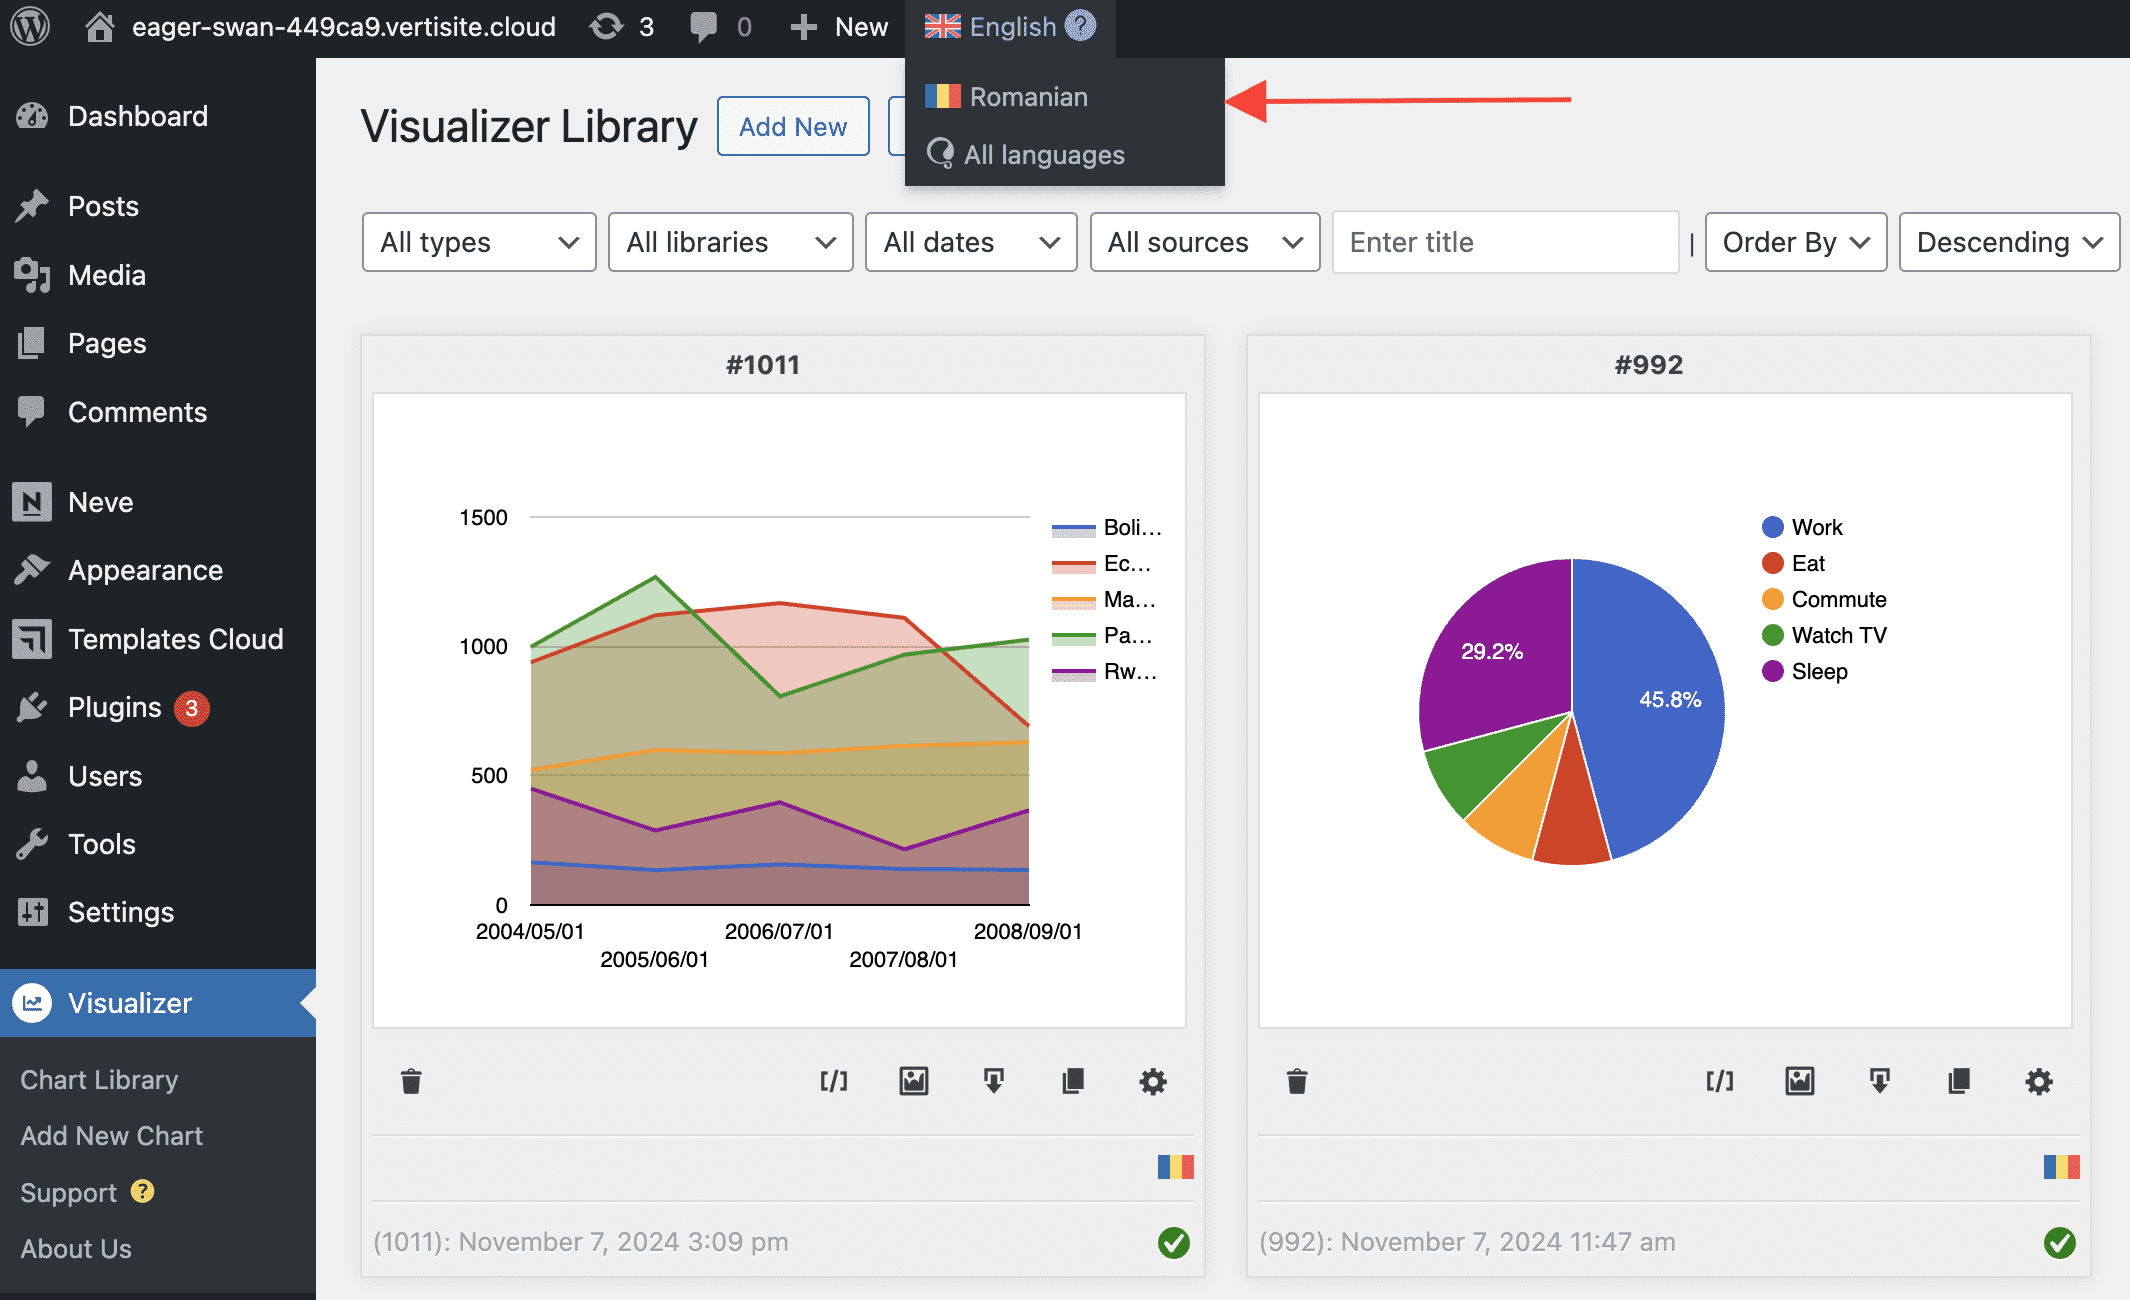
List all charts available in each language of the site
5. The chart can be displayed as normal, using its shortcode in a page. Just make sure you create a corresponding page for every language of the site in WPML.
Translate with TranslatePress
1. Setup the TranslatePress plugin
For this part, we recommend you follow the official recommendations from TranslatePress.
The free version of TranslatePress allows you to add one additional language. If you need more than that, you can upgrade to the paid version, which will let you translate your site into unlimited languages. Also, TranslatePress allows you to connect your site to Google Translate API or DeepL – an advanced machine translation solution (DeepL is available with the pro version of TranslatePress).
2. Translate posts and pages with TranslatePress
Translating posts and pages with TranslatePress is very simple and intuitive.
Just click on the Translate Page button at the top of the page, select any element of the page and add the translation of your choice.
Translate Hestia's frontpage using TranslatePress
To "translate" images, meaning to have different images for different languages of the site, make sure to have two different images uploaded in the Media Library, and add their corresponding links in TranslatePress editor.
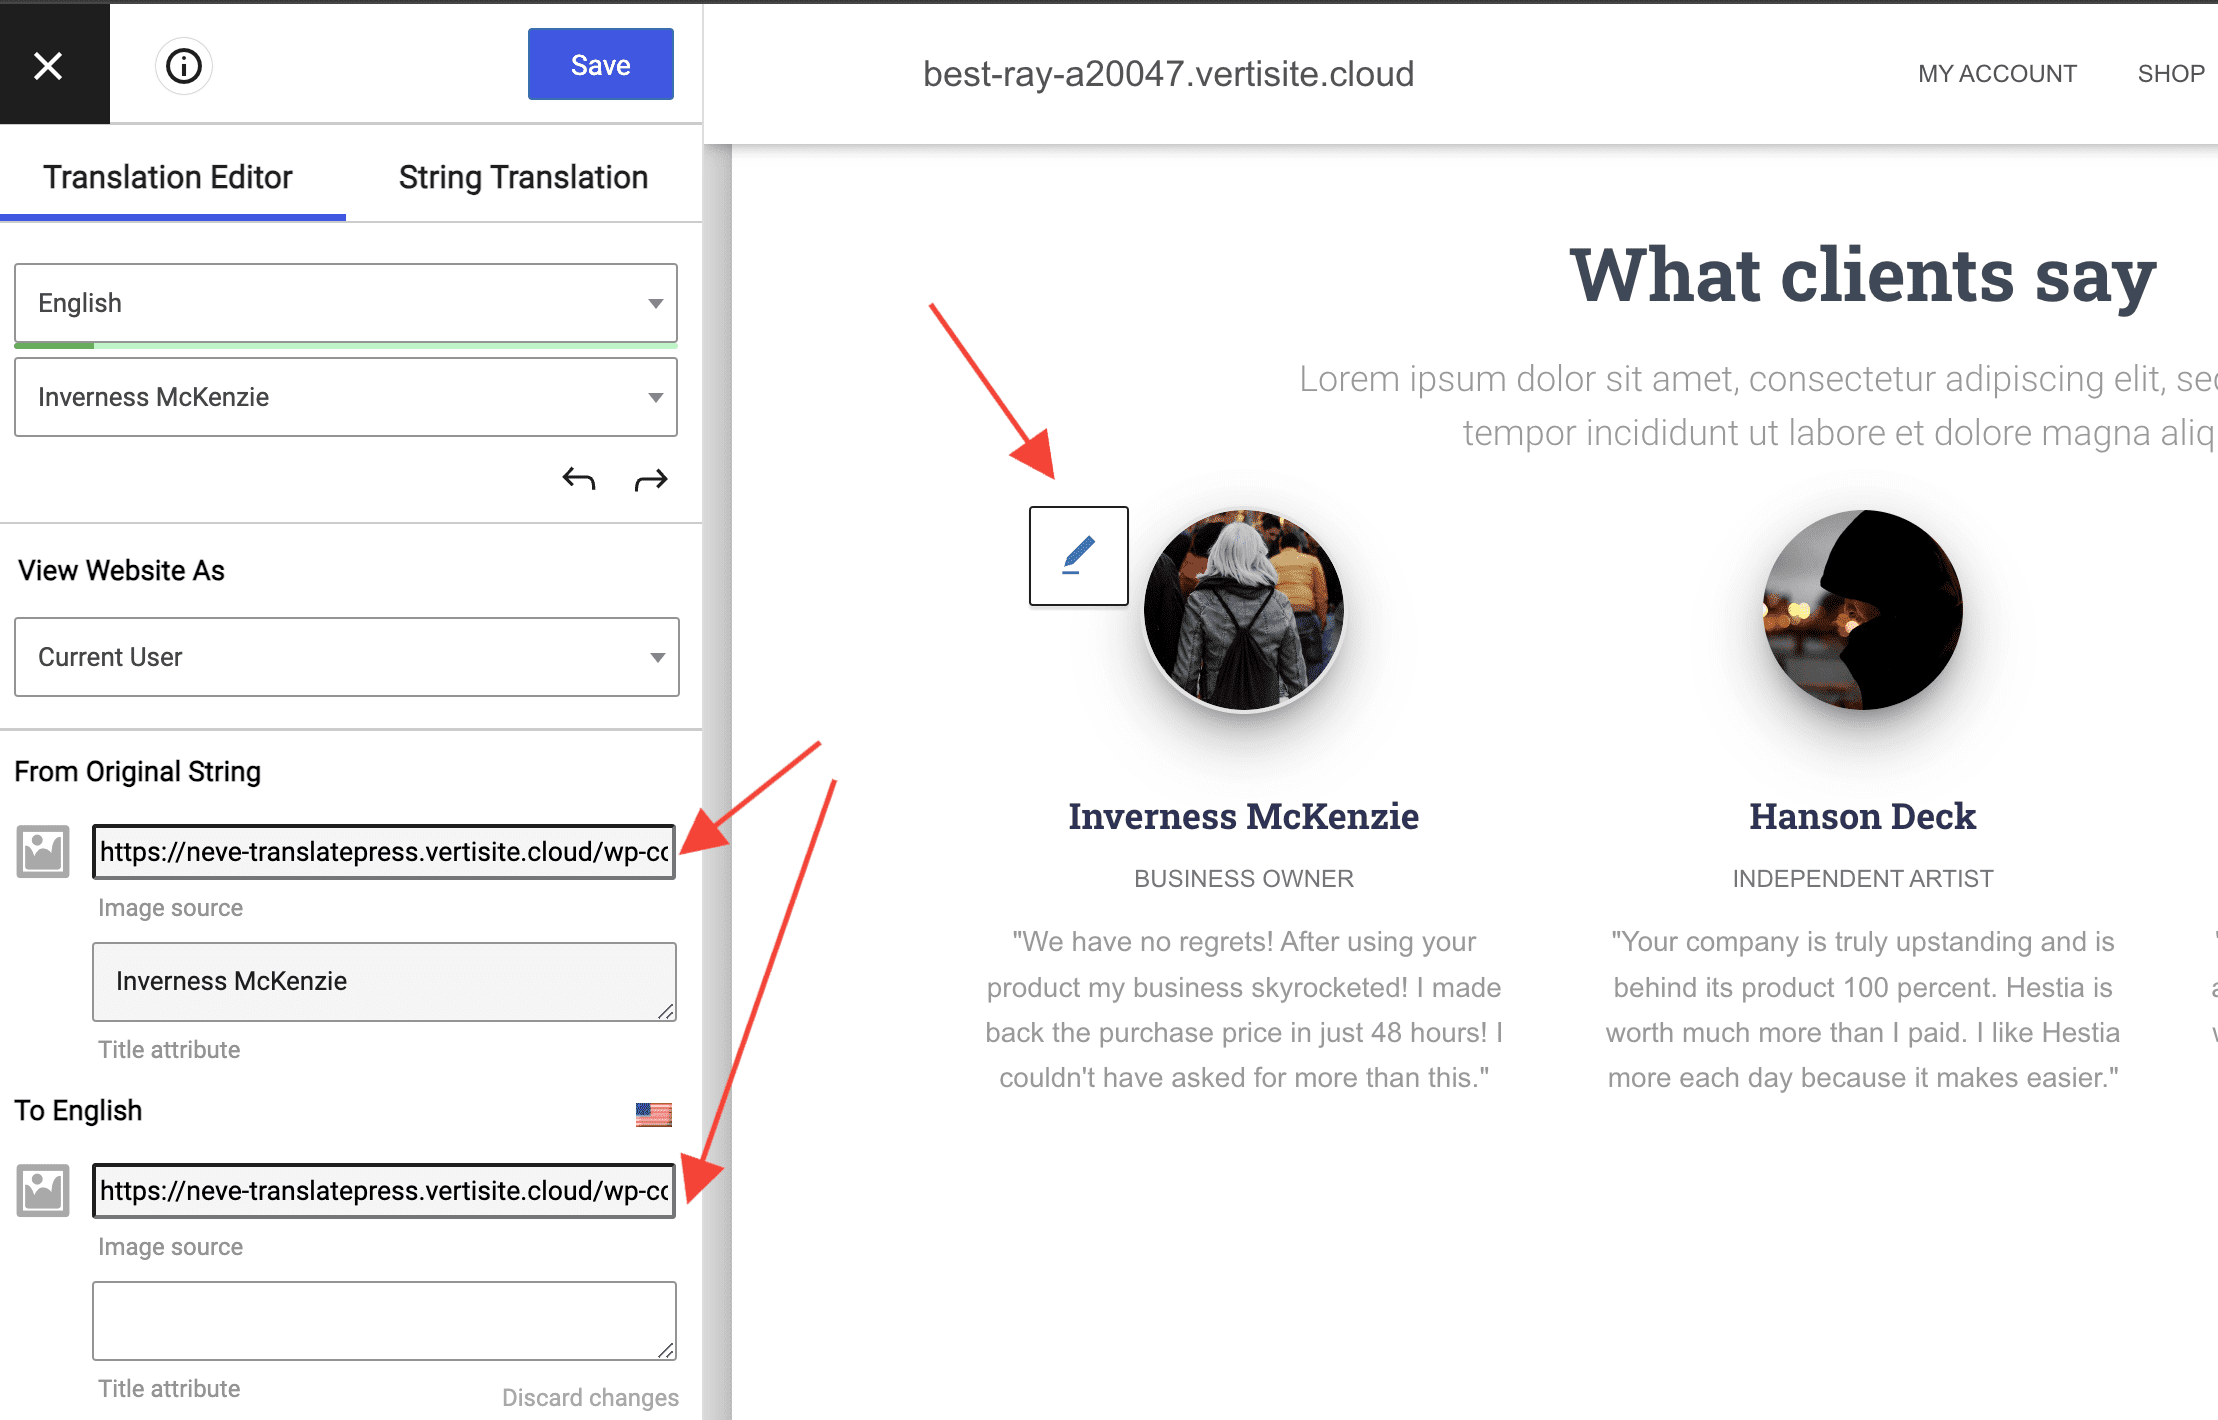
"Translate" images with TranslatePress
3. Translate SEO parameters of your site with TranslatePress
Translating key SEO parameters of your site is an important step for your translated pages to appear in Google searches correctly.
The premium version of TranslatePress allows you to handle this through the SEO Pack add-on. It has options for translating your pages URLs, page titles and descriptions.
4. "Translate" the background images from Hestia PRO's frontpage sections with TranslatePress
To have different background images for Hestia PRO's frontpage sections, in different languages, you'd need to add some custom CSS in Appearance > Customize > Additional CSS.
Each language configured in the plugin adds a CSS selector on the frontpage (for example: .translatepress-en_US ).
Based on this selector, each frontpage section's background-image can be targeted and replaced with another image URL
Here are a few examples (that need to be adjusted for each particular case):
/* Big Title section (Hestia free) */
.home.translatepress-en_US #carousel-hestia-generic .item > .page-header > .header-filter {
    background-image: url('https://live.staticflickr.com/5797/21575333719_2e2b3b658c_o.jpg?fdl=1') !important; }
/* Slider section (Hestia Pro) */
.home.translatepress-en_US #carousel-hestia-generic .item.item-1 > .page-header > .header-filter {
background-image: url('https://live.staticflickr.com/5797/21575333719_2e2b3b658c_o.jpg?fdl=1') !important; }/* About section */
.home.translatepress-en_US .hestia-about section-image {
background-image: url('https://live.staticflickr.com/5797/21575333719_2e2b3b658c_o.jpg?fdl=1') !important; }/* Ribbon section */
.home.translatepress-en_US .hestia-ribbon {
background-image: url('https://live.staticflickr.com/5797/21575333719_2e2b3b658c_o.jpg?fdl=1') !important; }/* Subscribe section */
.home.translatepress-en_US .hestia-subscribe {
background-image: url('https://live.staticflickr.com/5797/21575333719_2e2b3b658c_o.jpg?fdl=1') !important; }/* Contact section */
.home.translatepress-en_US .hestia-contact {
background-image: url('https://live.staticflickr.com/5797/21575333719_2e2b3b658c_o.jpg?fdl=1') !important; }