How to add Grid Lines to the Graph?
You can easily add grid lines to the chart, following these steps:
1. Navigate to Visualizer > Charts Library and pick the desired one.
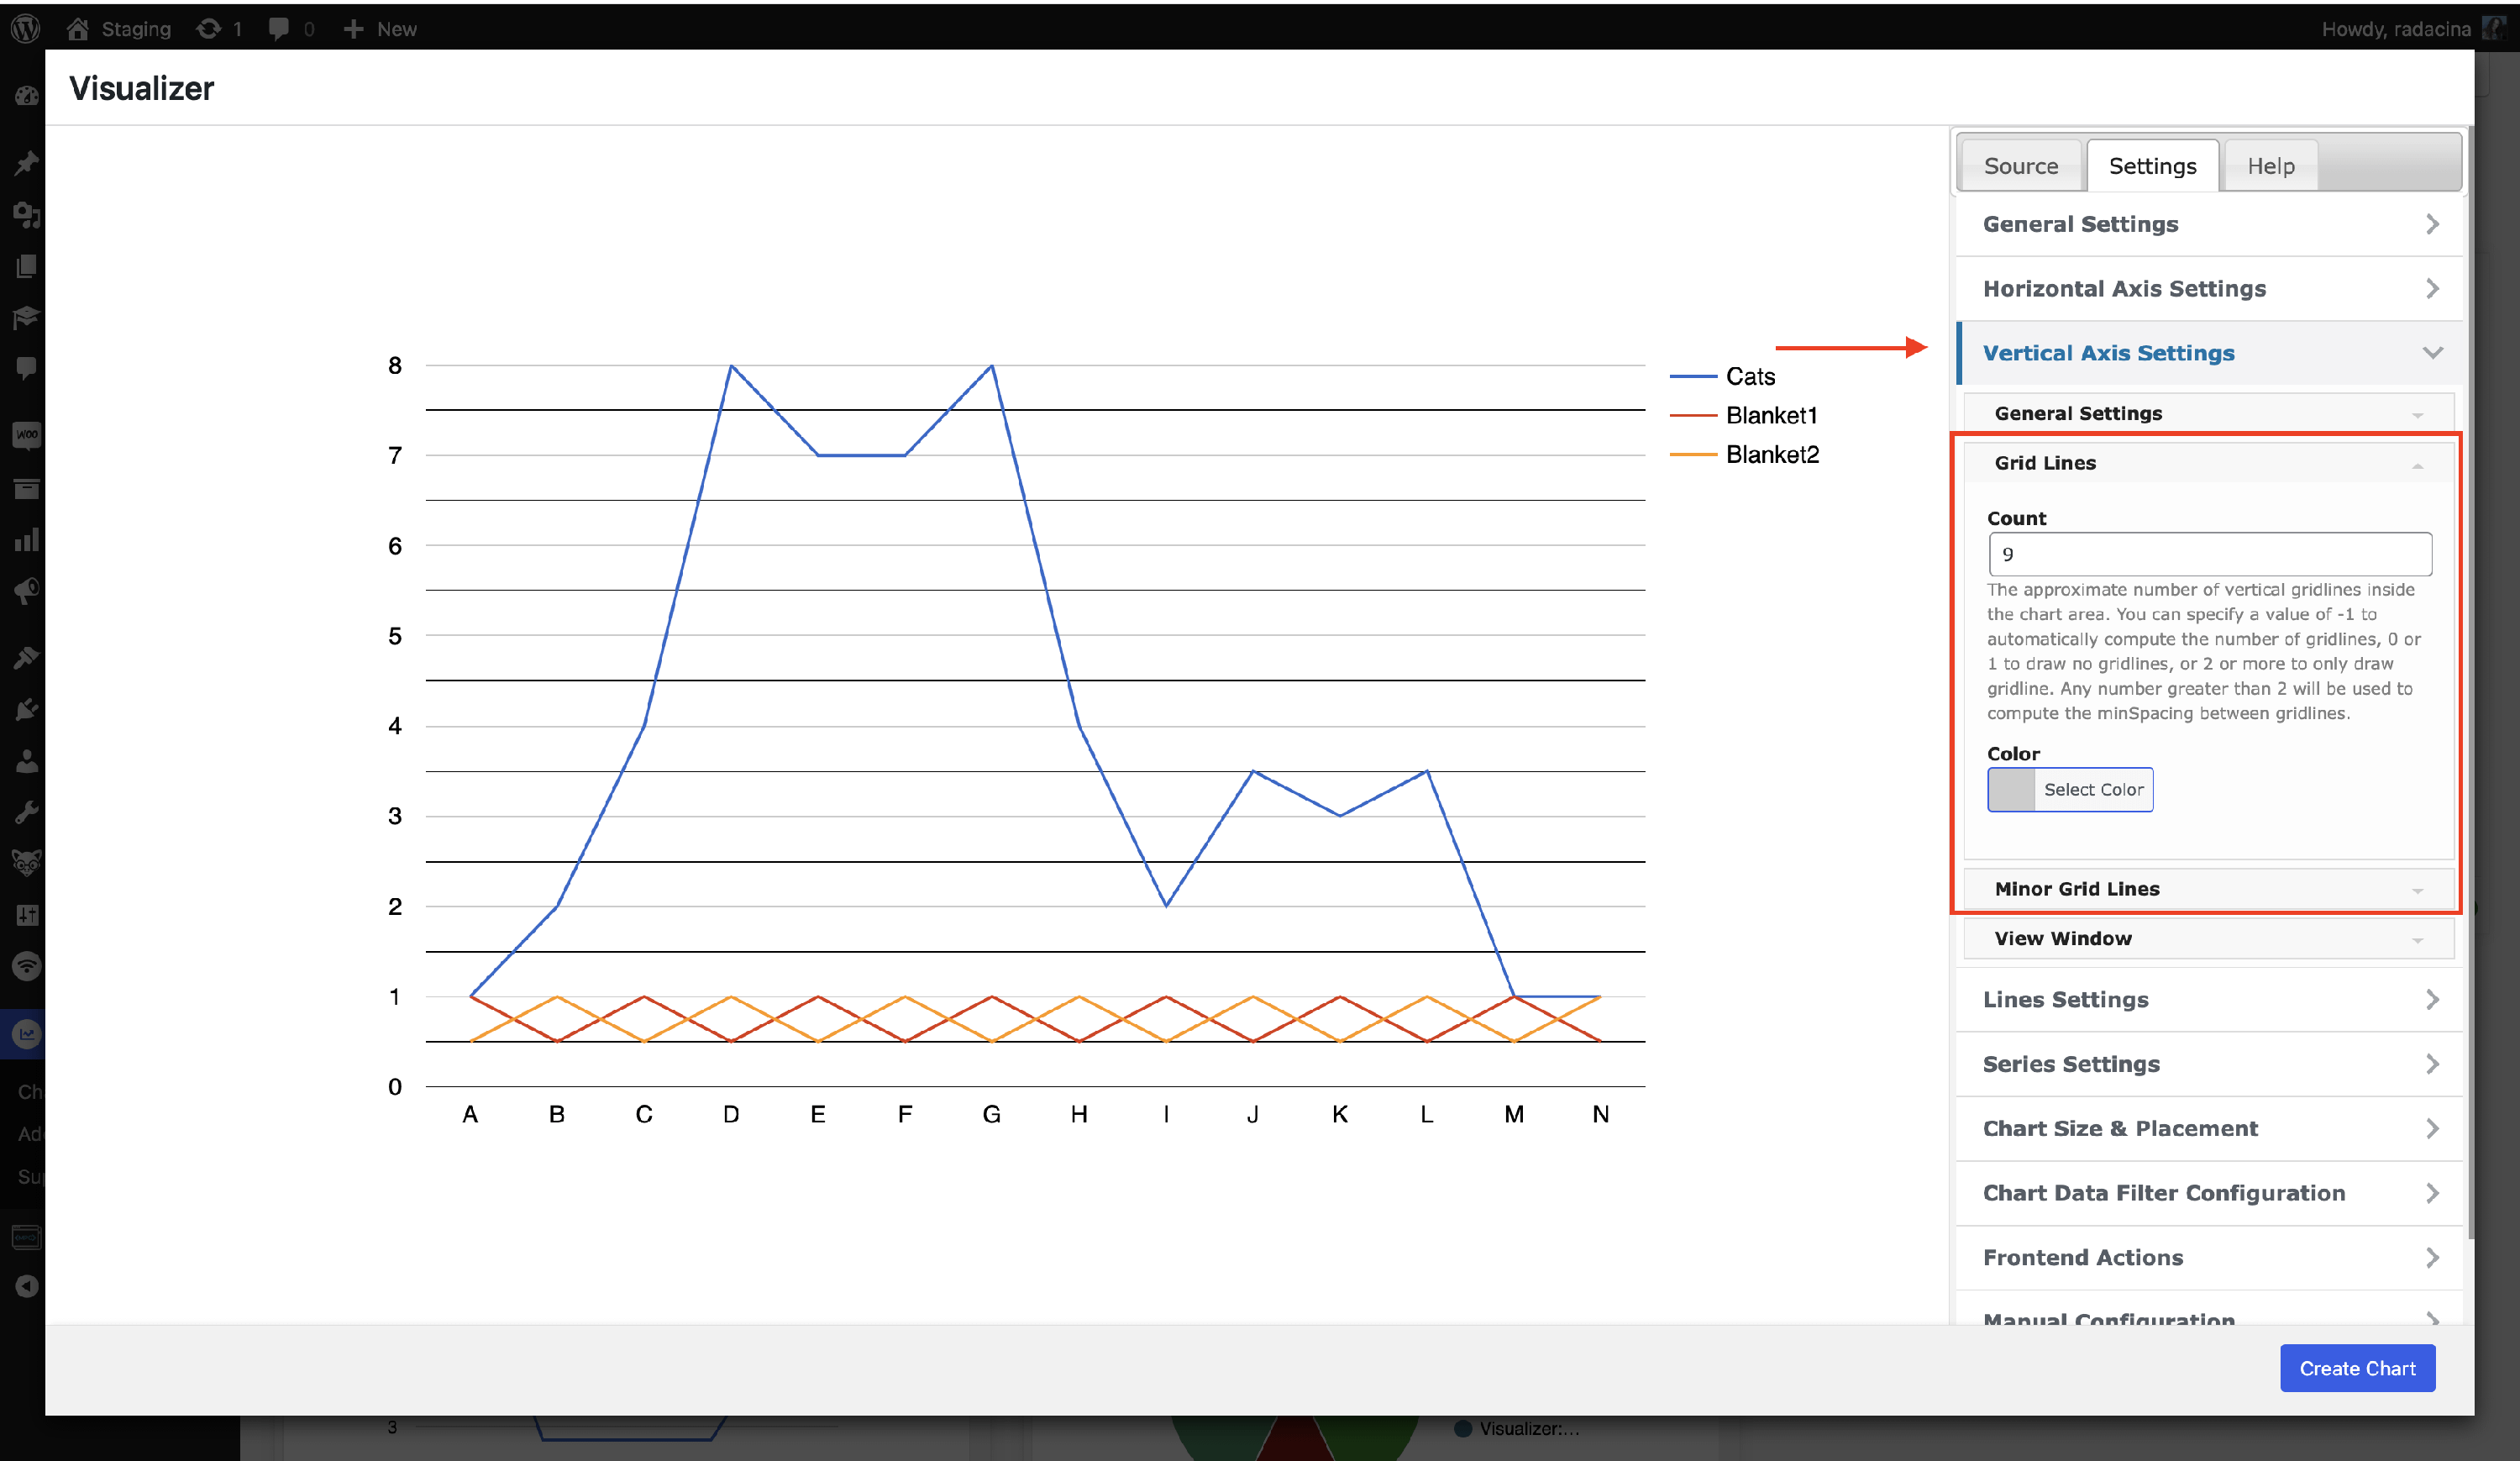
2. Go to the Settings Tab > Vertical Axis Settings.
3. Adjust the colors and settings of the Gridlines and Minor Grid Lines.