How to change Line Chart's Vertical Axis color?
The Line Chart is one of the most familiar charts used to display data.
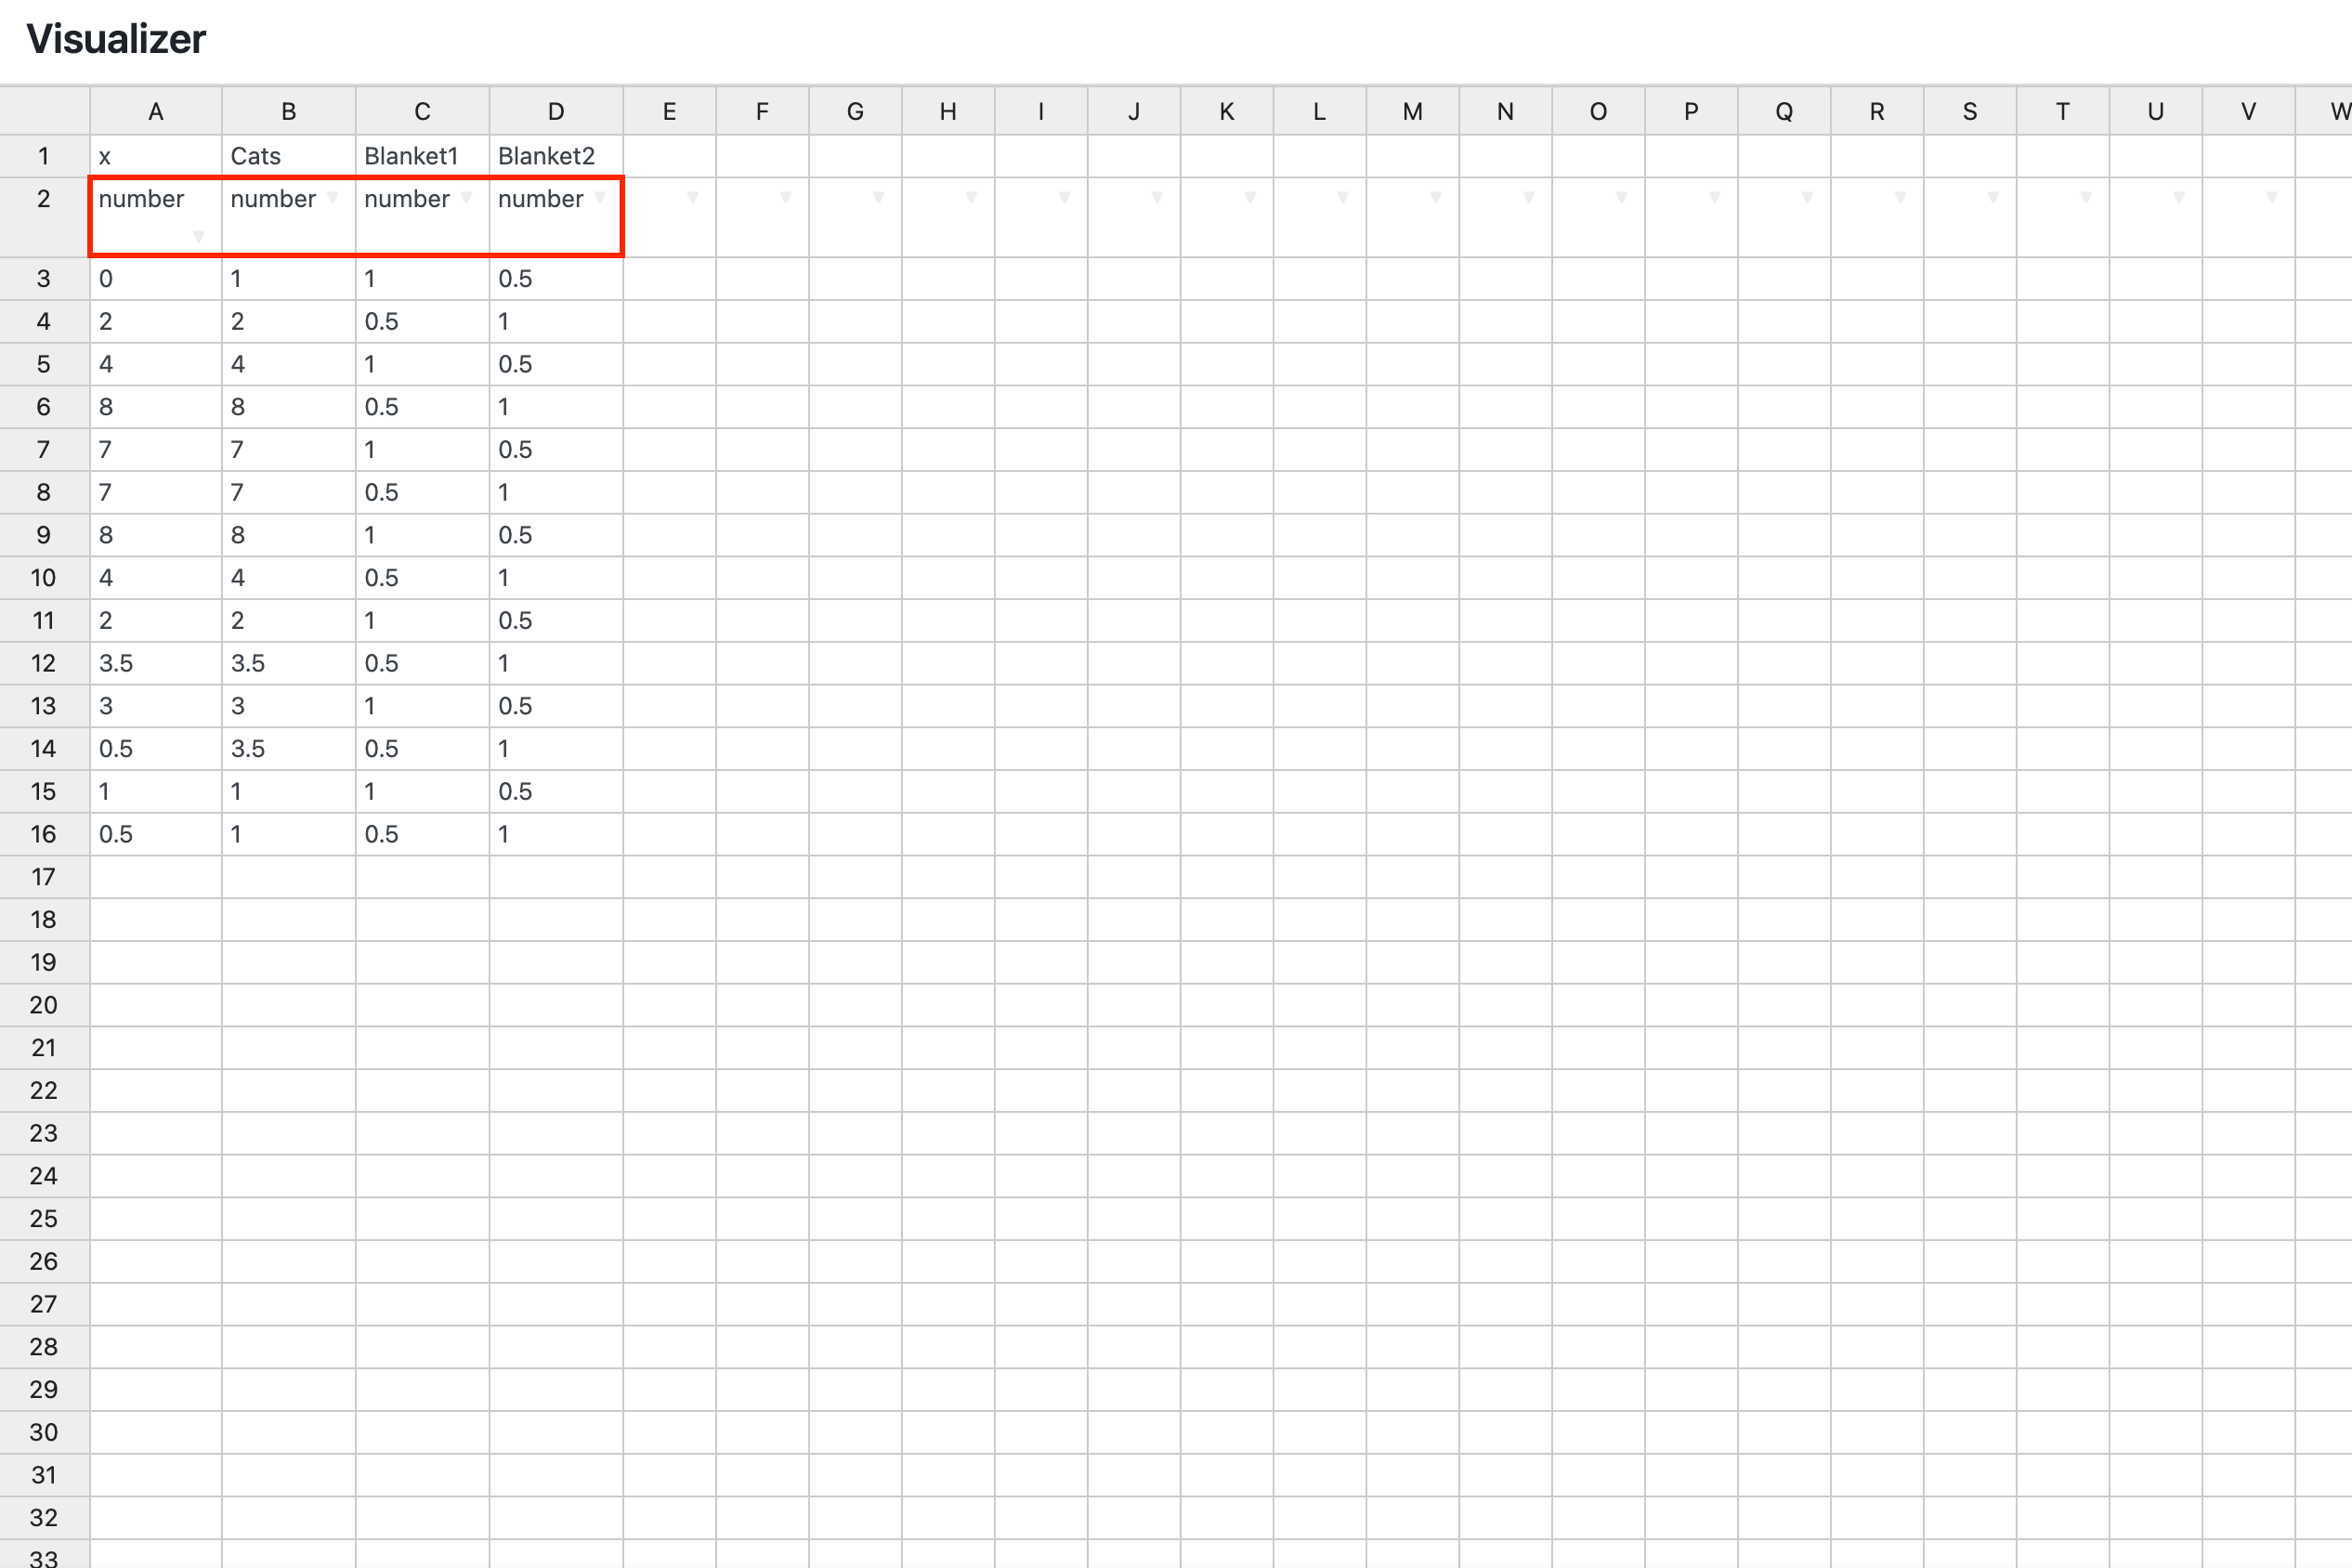
In order to have the vertical axis visible and change its color, you have to make sure that all the columns of your source file have the numeric data types:
1. Navigate to Visualizer > Charts Library.
2. Select an existing one or create a new one ( Line Chart ).
3. Make sure that the file inserted by you has the numeric data type for each column.
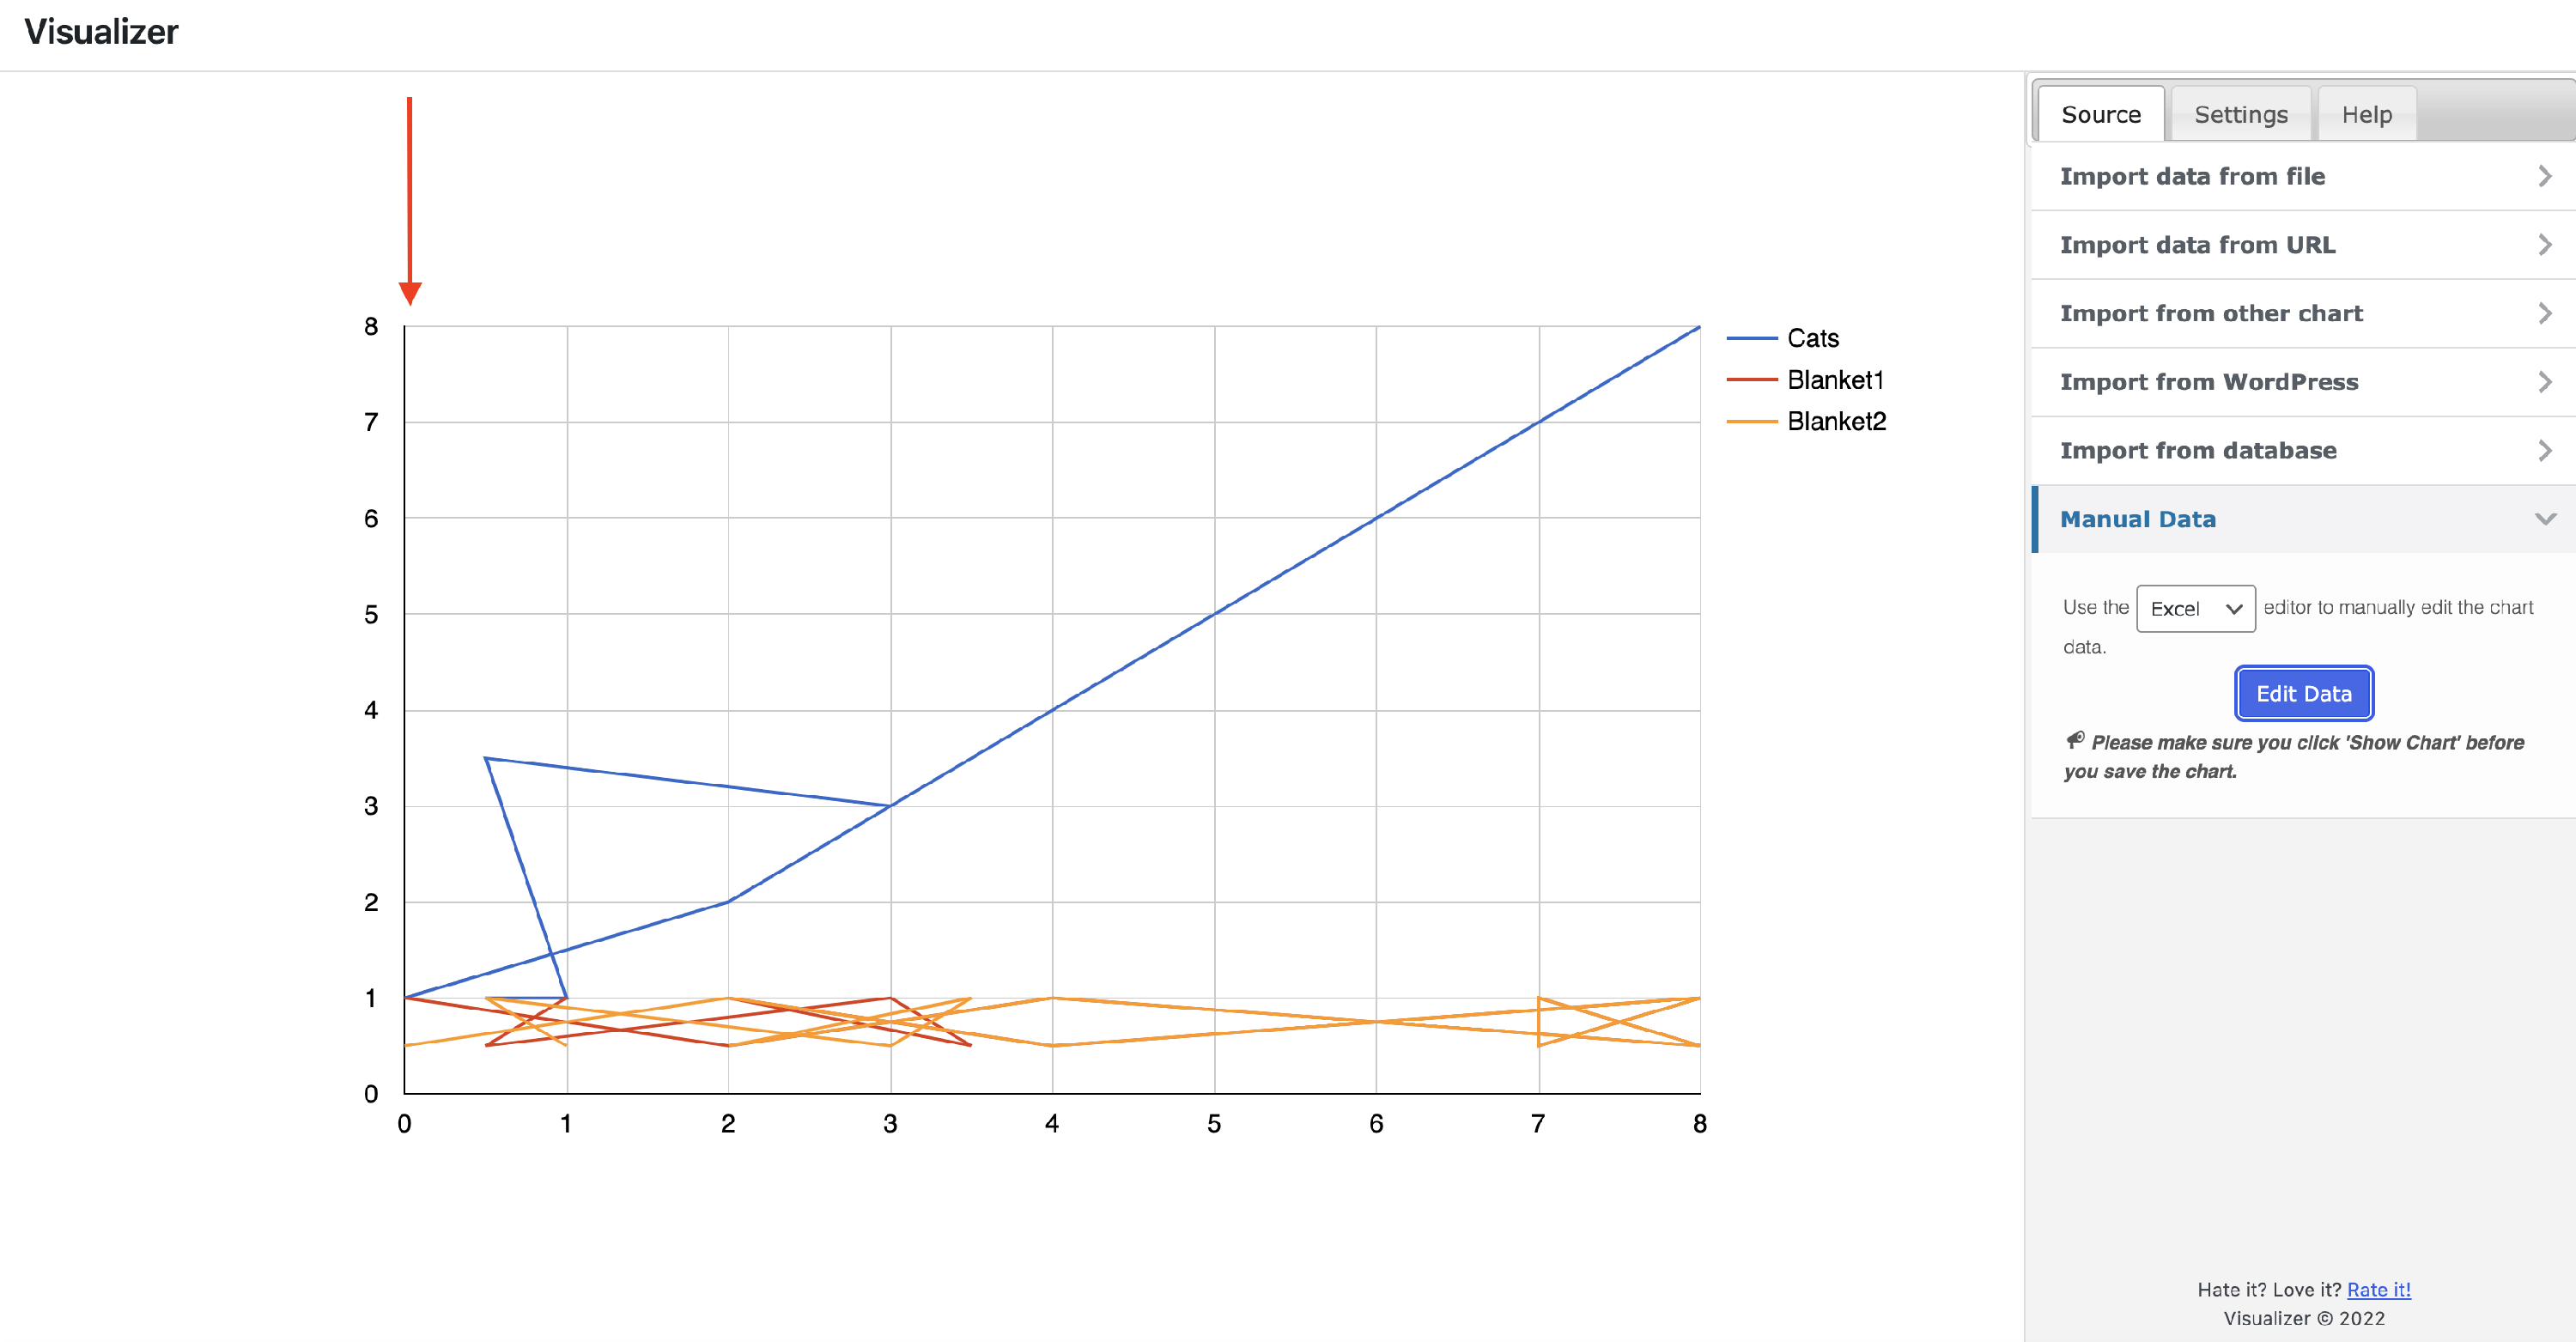
4. After that, you will be able to see the baseline:
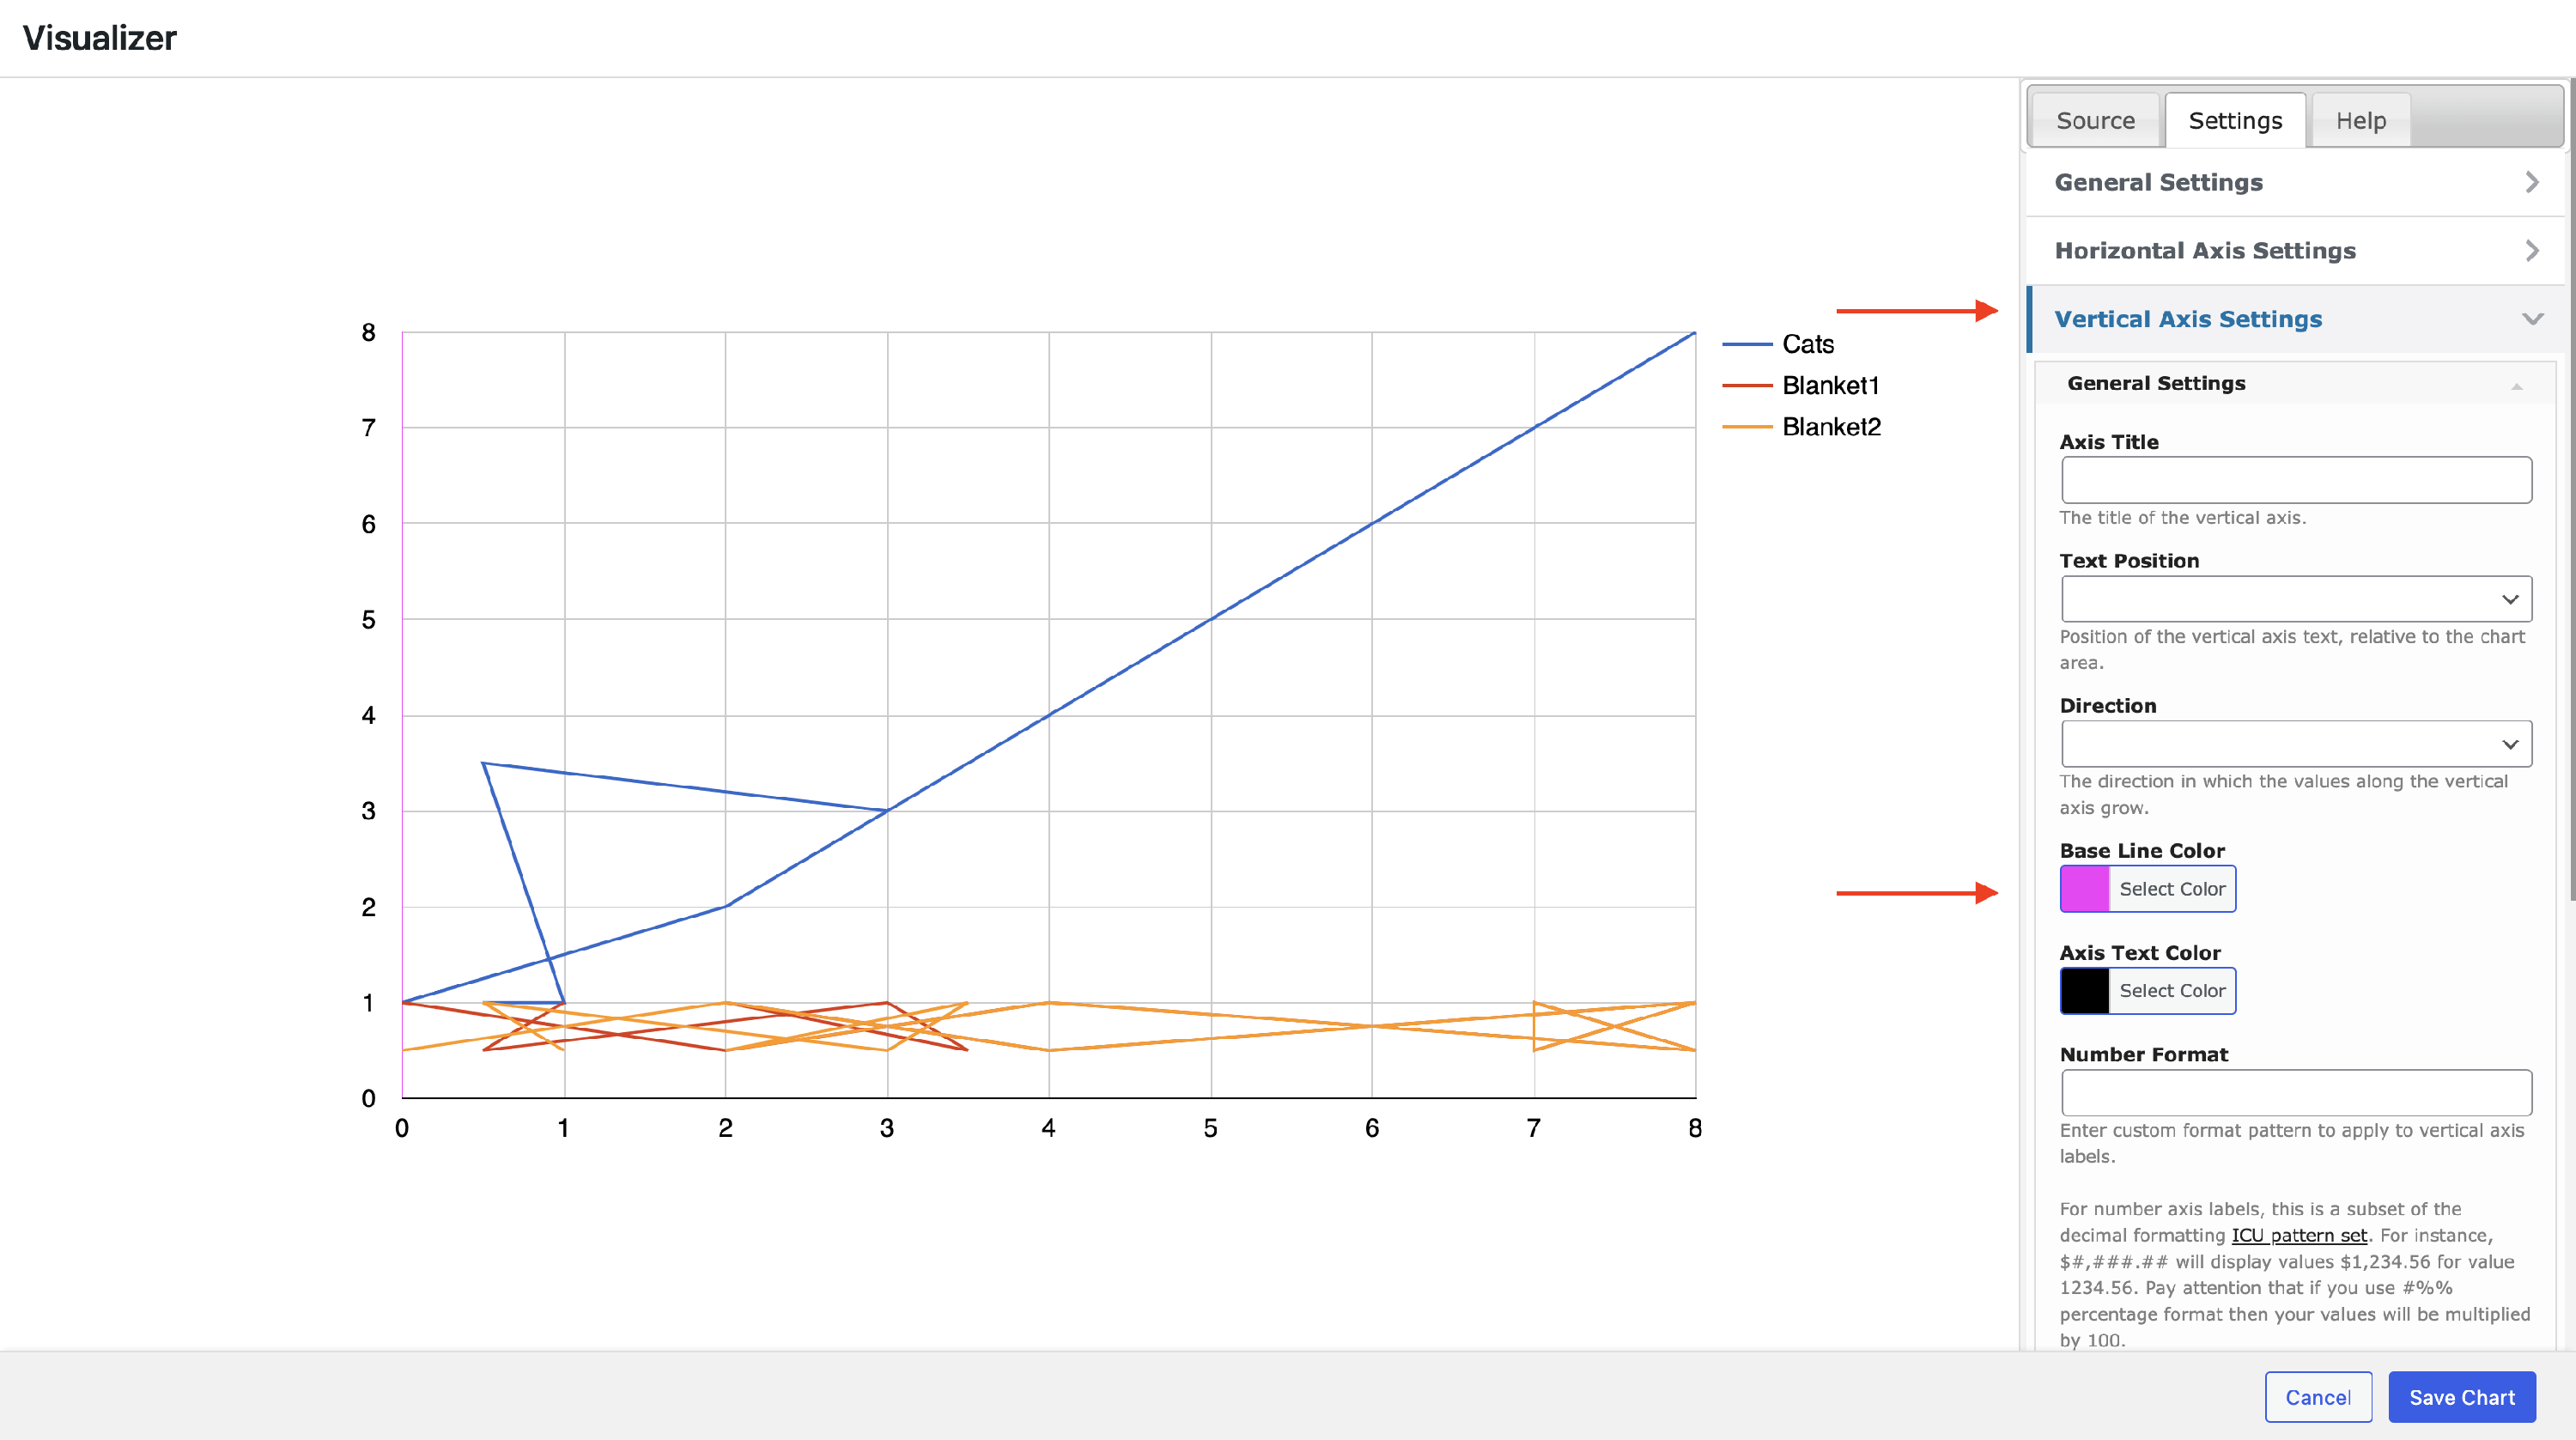
5. To change its color, navigate to Settings > Vertical Axis > General Settings > Base Line Color.