How to change colour of graphs in Visualizer
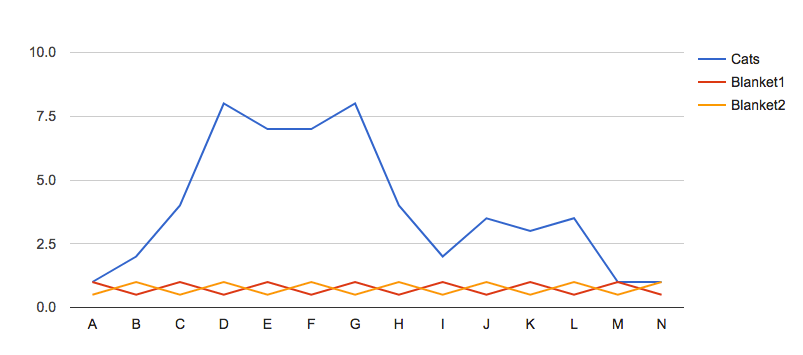
Before the color change:
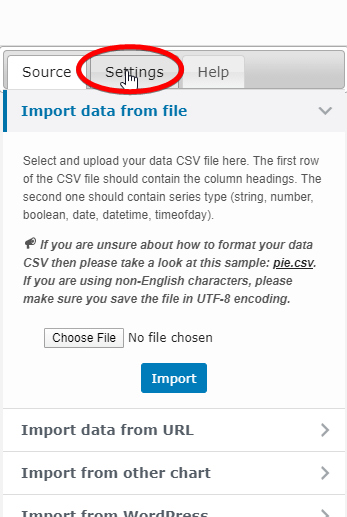
Go to Visualizer > Chart Library and edit the chart you want to customize, and click settings.
Go to Series Settings, and there will be your series options.

Click on each option, and in the end, you'll find an option: Color.
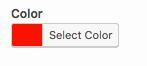
Choose the color of your choice and click Save Chart to apply the new colors to your chart.
After the color change:

Note: If you'd like to further customize your chart, consider using the Style Role feature. Learn more here: Style Role Details