How can I highlight a single bar?
Sometimes it happens that we need to emphasize a specific bar on a chart, and it looks like we can’t do it via chart settings… It’s true, but only from one side. On another side, we can use a small trick to help us achieve what we need.
Prepare your data
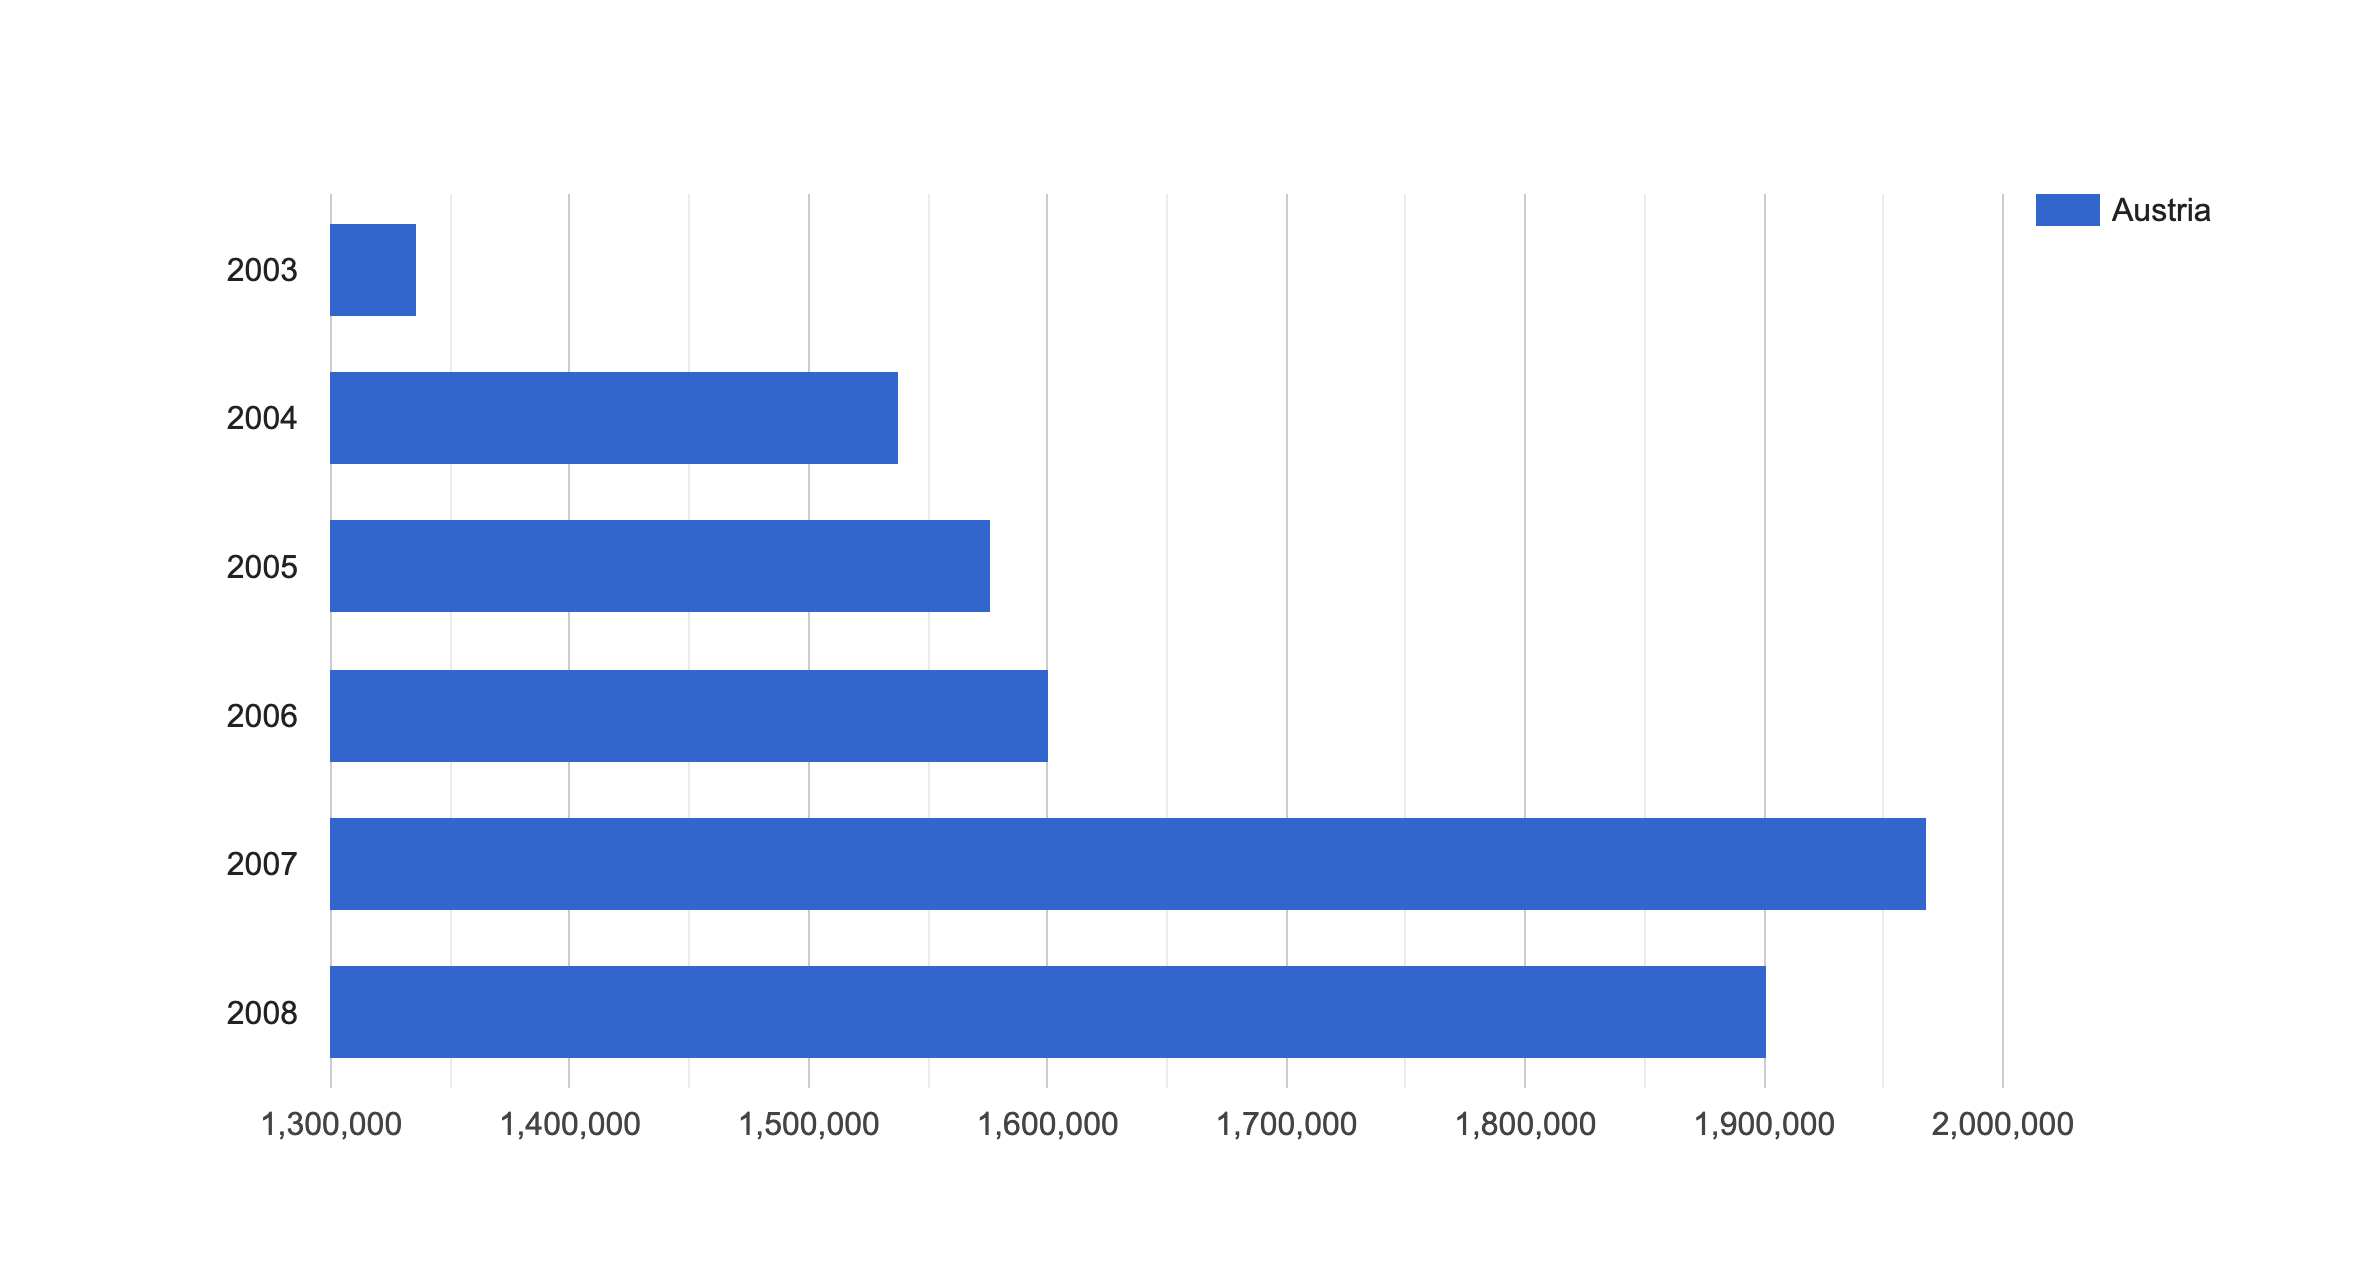
The first thing which we have to do is to prepare our data. Let's assume we have a chart with one series, and its data could look like this:
Year	|   Austria
string	|   number
2003	|   1336060
2004	|   1538156
2005	|   1576579
2006	|   1600652
2007	|   1968113
2008	|   1901067
How the chart looks like
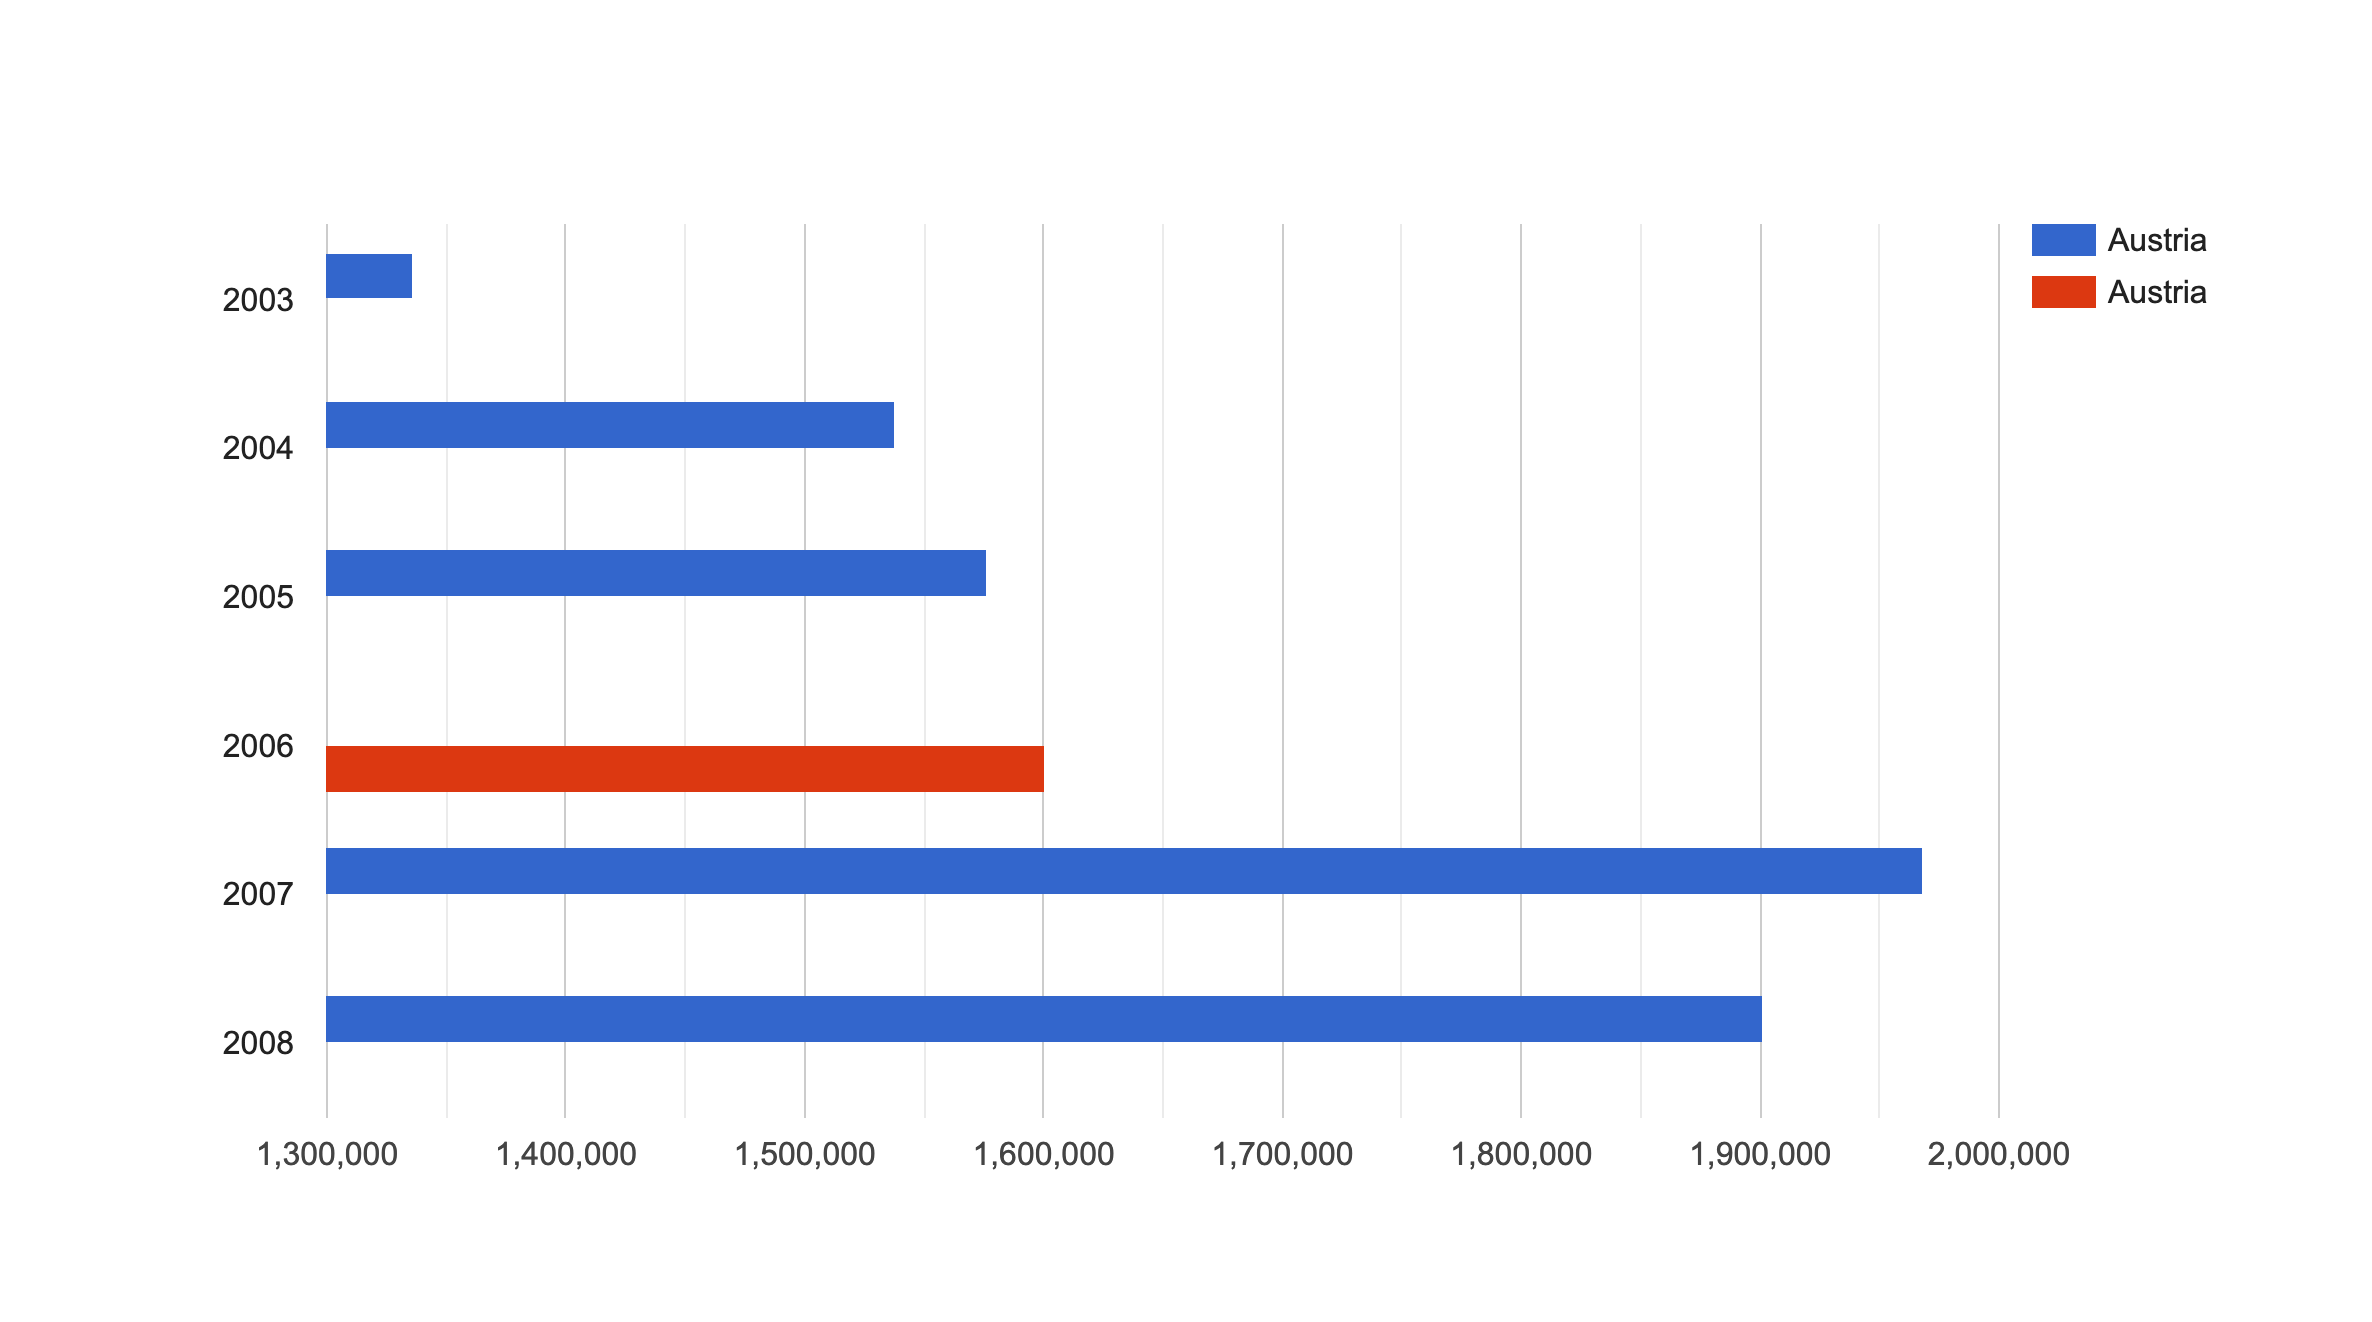
For example, we want to highlight a value for the 2006 year. In this case, we need to add one more column with the same title and type as the first series but with empty values:
Year	|   Austria	|   Austria
string	|   number	|   number
2003	|   1336060	|
2004	|   1538156	|
2005	|   1576579	|
2006	|   1600652	|
2007	|   1968113	|
2008	|   1901067	|
And move the selected value from the first series to the second one:
Year	|   Austria	|   Austria
string	|   number	|   number
2003	|   1336060	|
2004	|   1538156	|
2005	|   1576579	|
2006	|               |   1600652
2007	|   1968113	|
2008	|   1901067	|
After doing so, save your CSV or XLSX file for data modifications.
Result
Setup chart
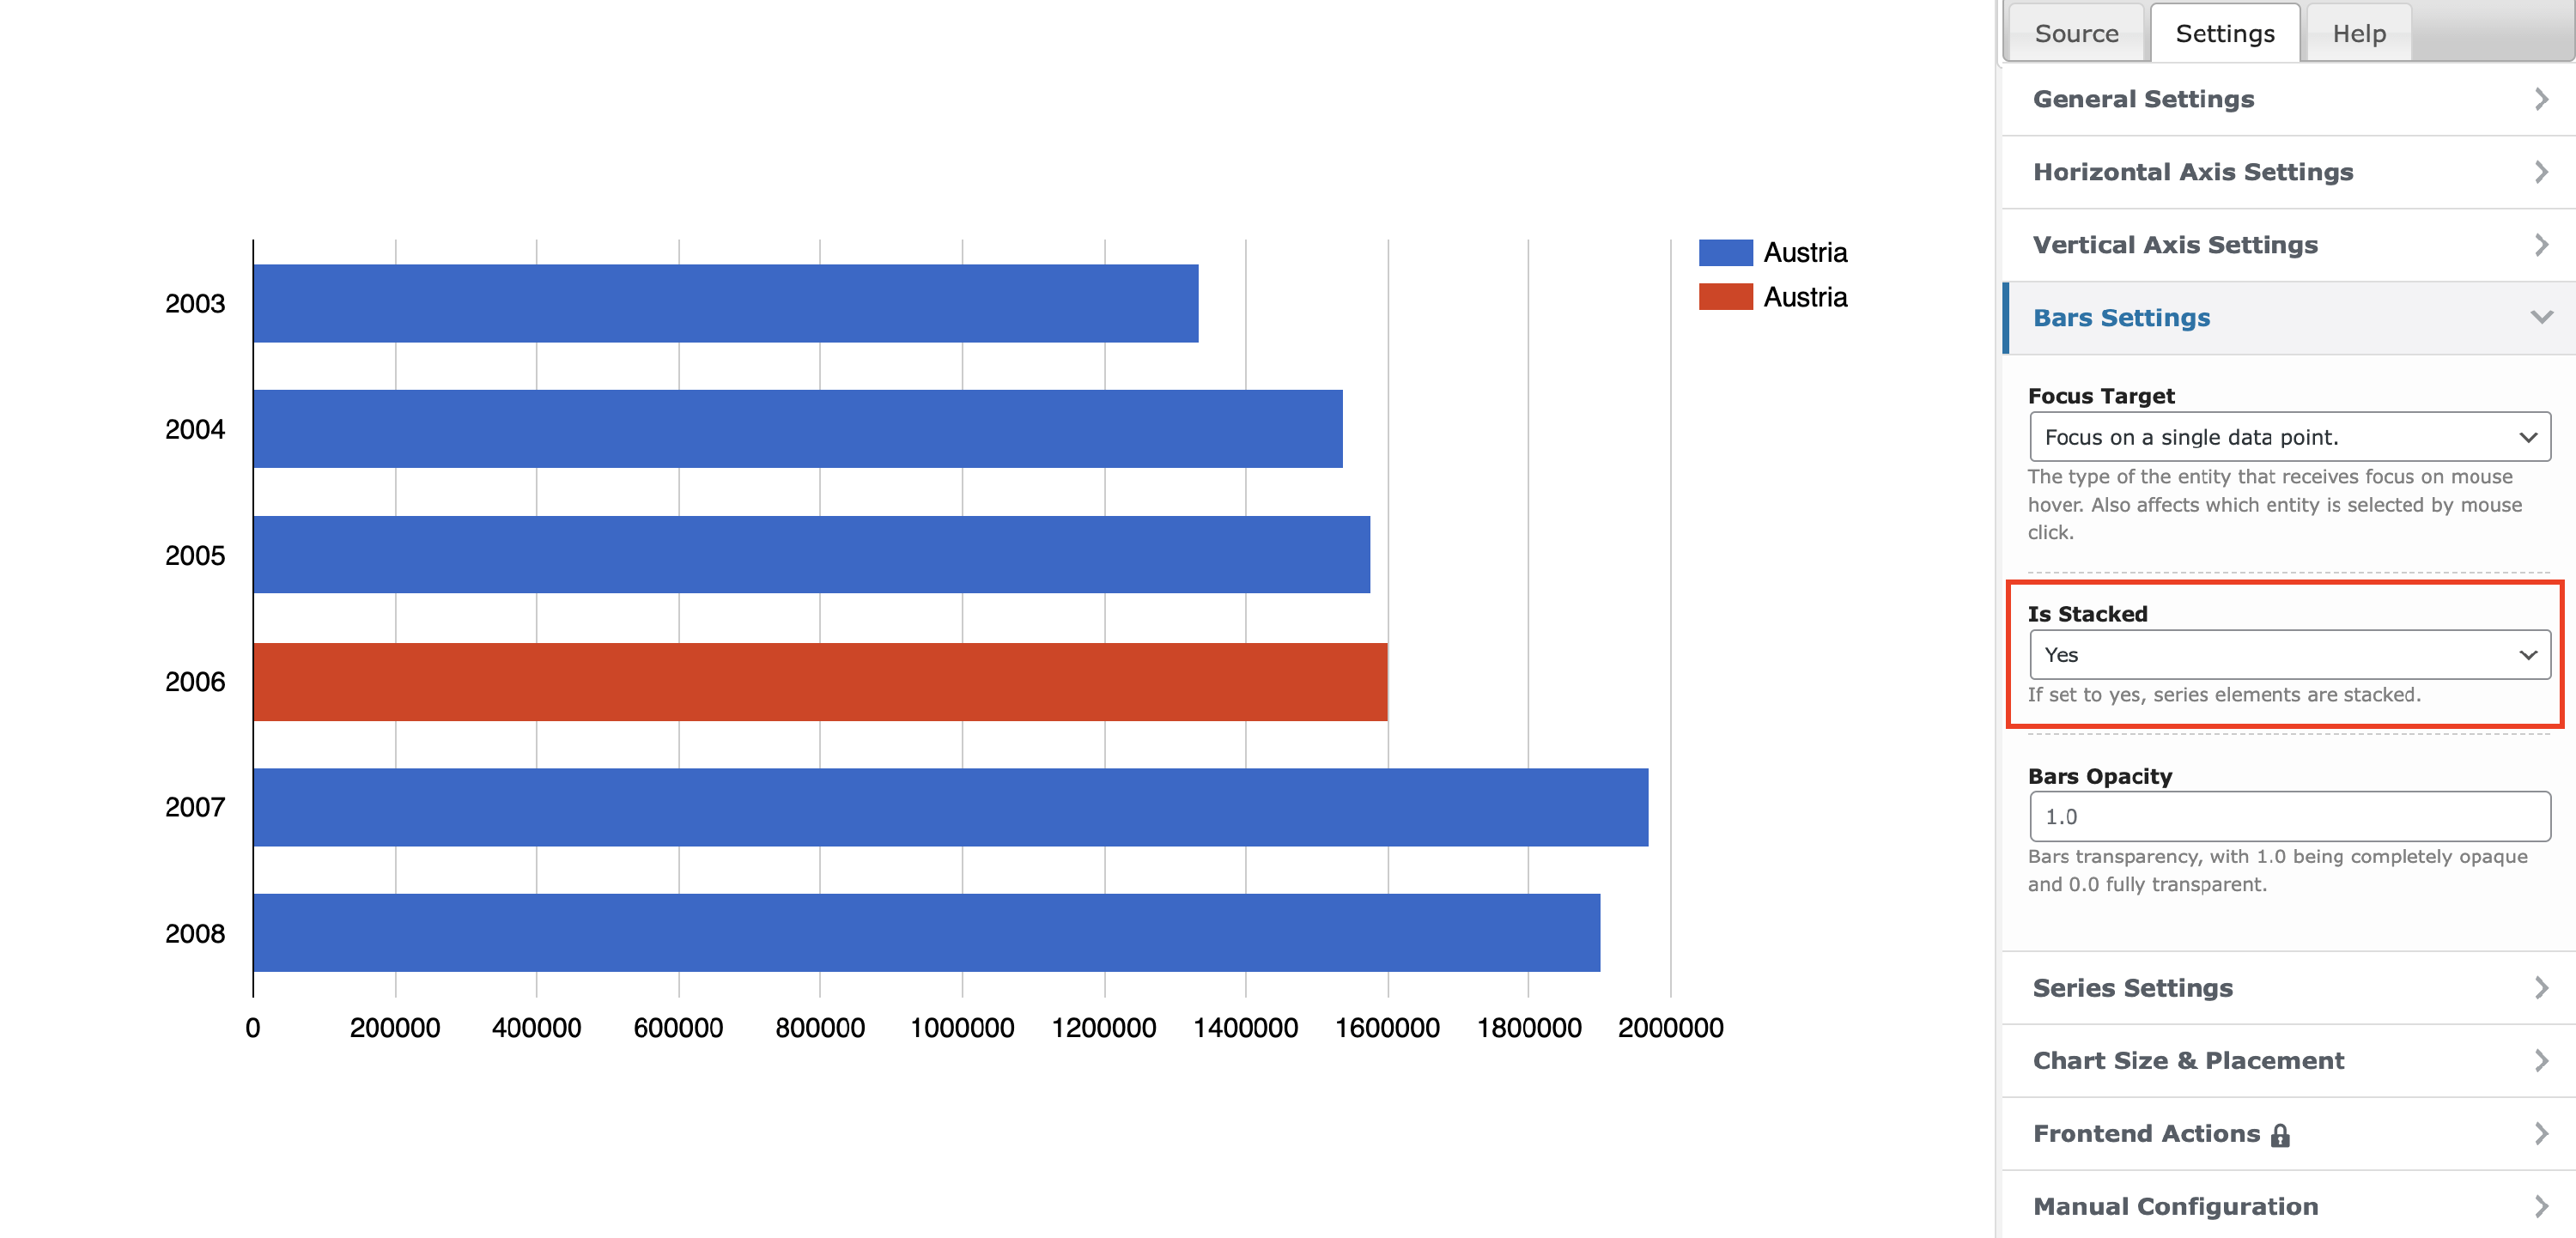
The second step is to set up the chart settings.
1. To do it, create a new chart or edit an existing one and upload a prepared CSV or XLSX file ( PRO ).
2. Go to the chart settings screen, and set the “Is Stacked” option to “Yes” from Bars Settings.
3. Then, remove the second series from legend by setting the “Visible In Legend” option to “No” in the appropriate series settings under the “Series Settings” group.
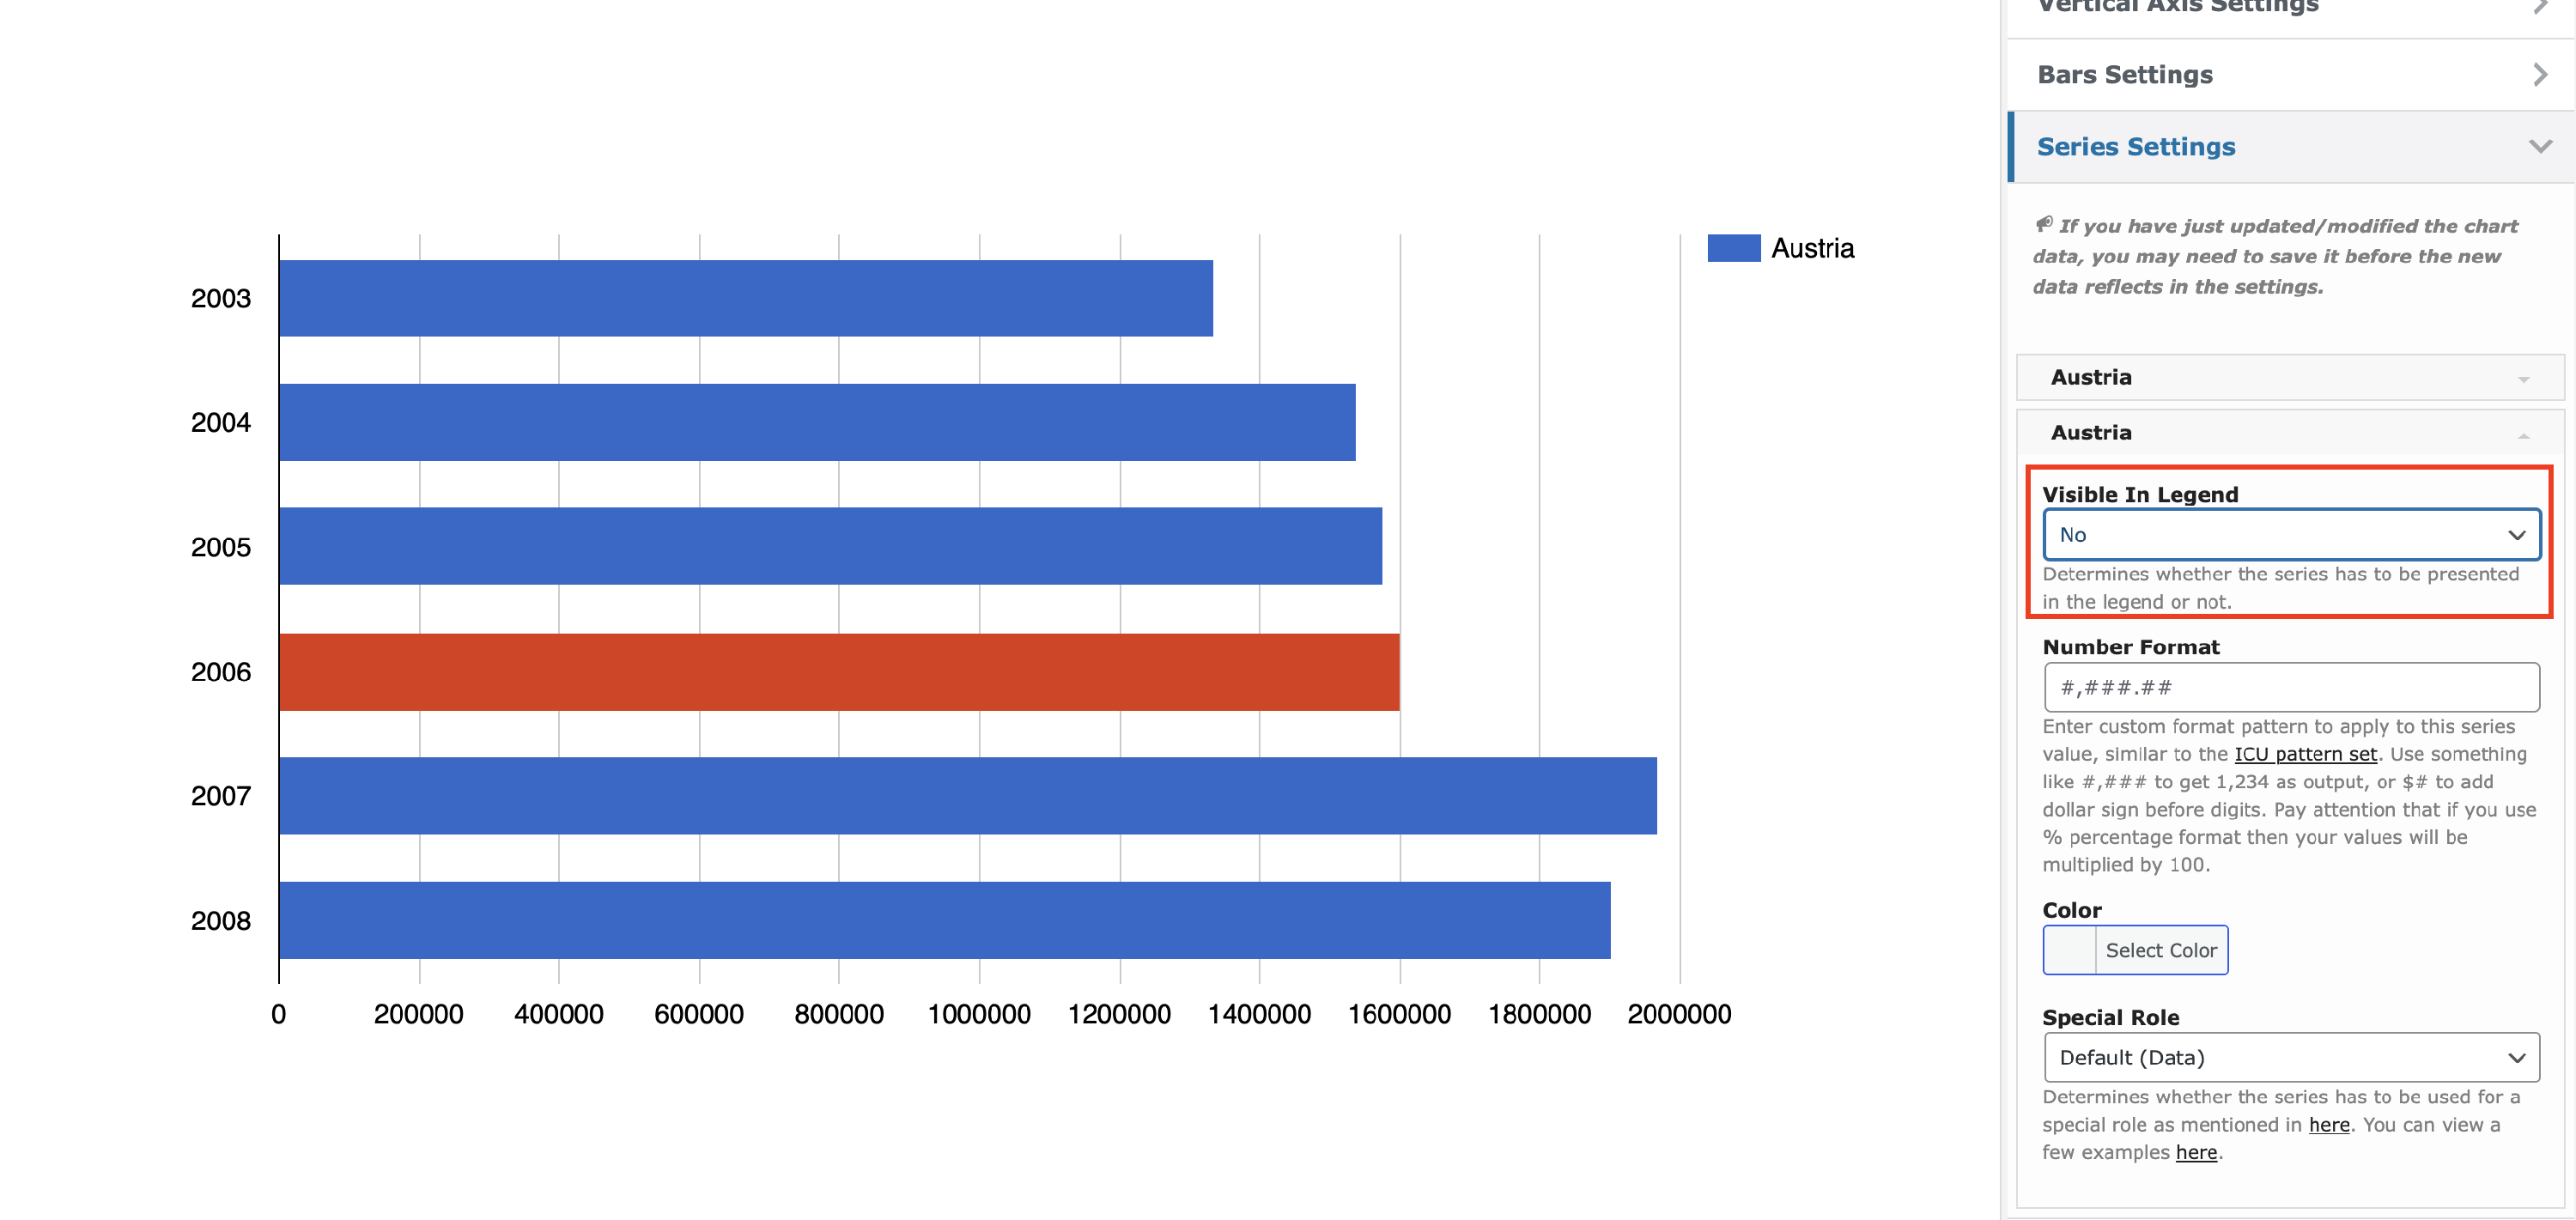
That’s all. Save the chart and embed it on a page.