How to add animations to charts in Visualizer
Animations can be a good way to make your chart more interactive, and fortunately, Google's Chart API allows us to add animations to charts in Visualizer.
There are two ways of adding animations to your charts.
1. Use the options provided by the plugin.
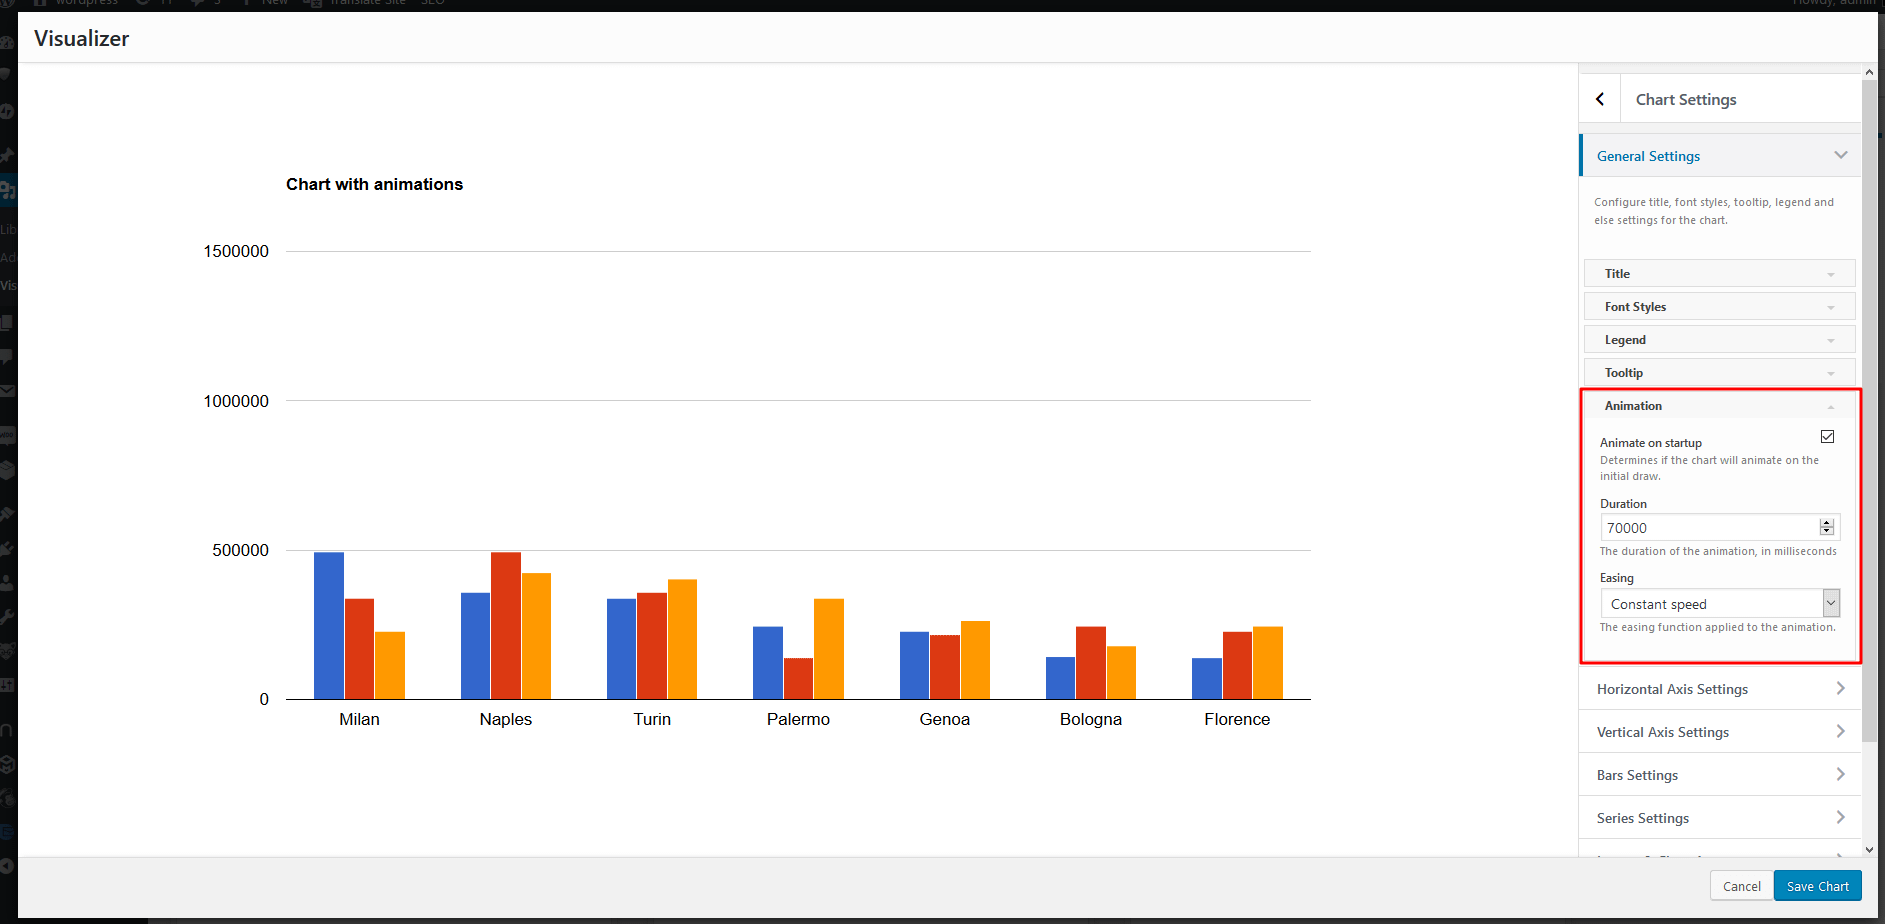
For each type of chart that supports animations, you can find the options needed in Advances > General Settings > Animation. There you can enable the animation ( check Animate on startup ), add a Duration ( in milliseconds ) for the animation and the way of Easing ( Constant speed, Start slow and speed up, Start fast and slow down, Start slow, speed up, then slow down ).
2. Custom code
You can add animations to chart by adding a JSON object to your chart from the Manual Configuration panel in Chart Settings, as seen in the screenshot below:
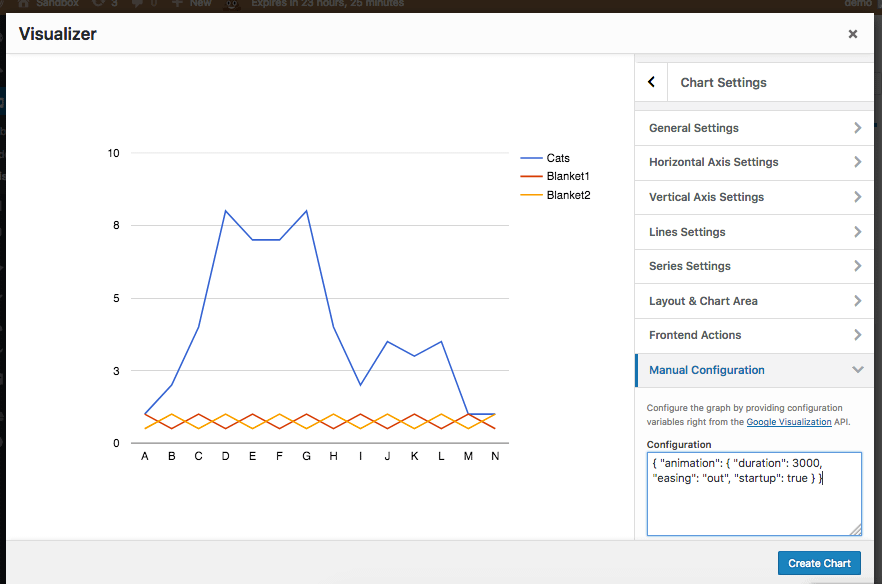
You can pass the following code to add a simple easing out animation to your chart:
{ "animation": { "duration": 3000, "easing": "out", "startup": true } }The object accepts three parameters, which are:
- duration: The duration of the animation, in milliseconds.
- easing: The easing function applied to the animation. The following options are available:
- 'linear' - Constant speed.
- 'in' - Ease in - Start slow and speed up.
- 'out' - Ease out - Start fast and slow down.
- 'inAndOut' - Ease in and out - Start slow, speed up, then slow down.
- startup: Determines if the chart will animate on the initial draw. If
true, the chart will start at the baseline and animate to its final state.