Annotation for data points - Visualizer: Charts and Graphs
If you want to point out the intersection of your chart's coordinates, this can be done with Visualizer with just a few steps.
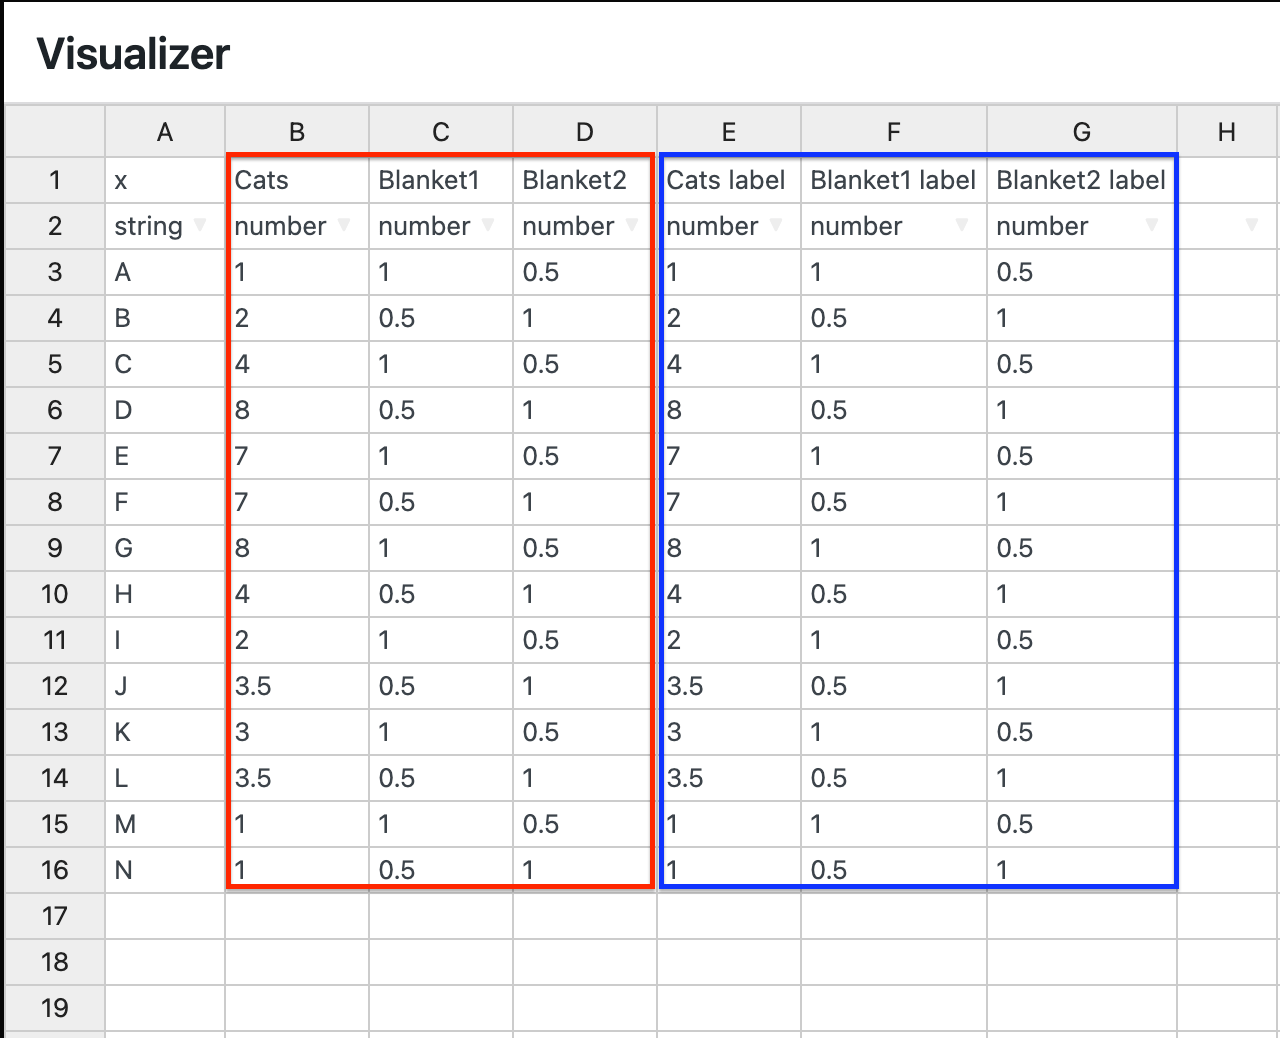
1. While editing a chart, make sure to duplicate the columns in the source file:
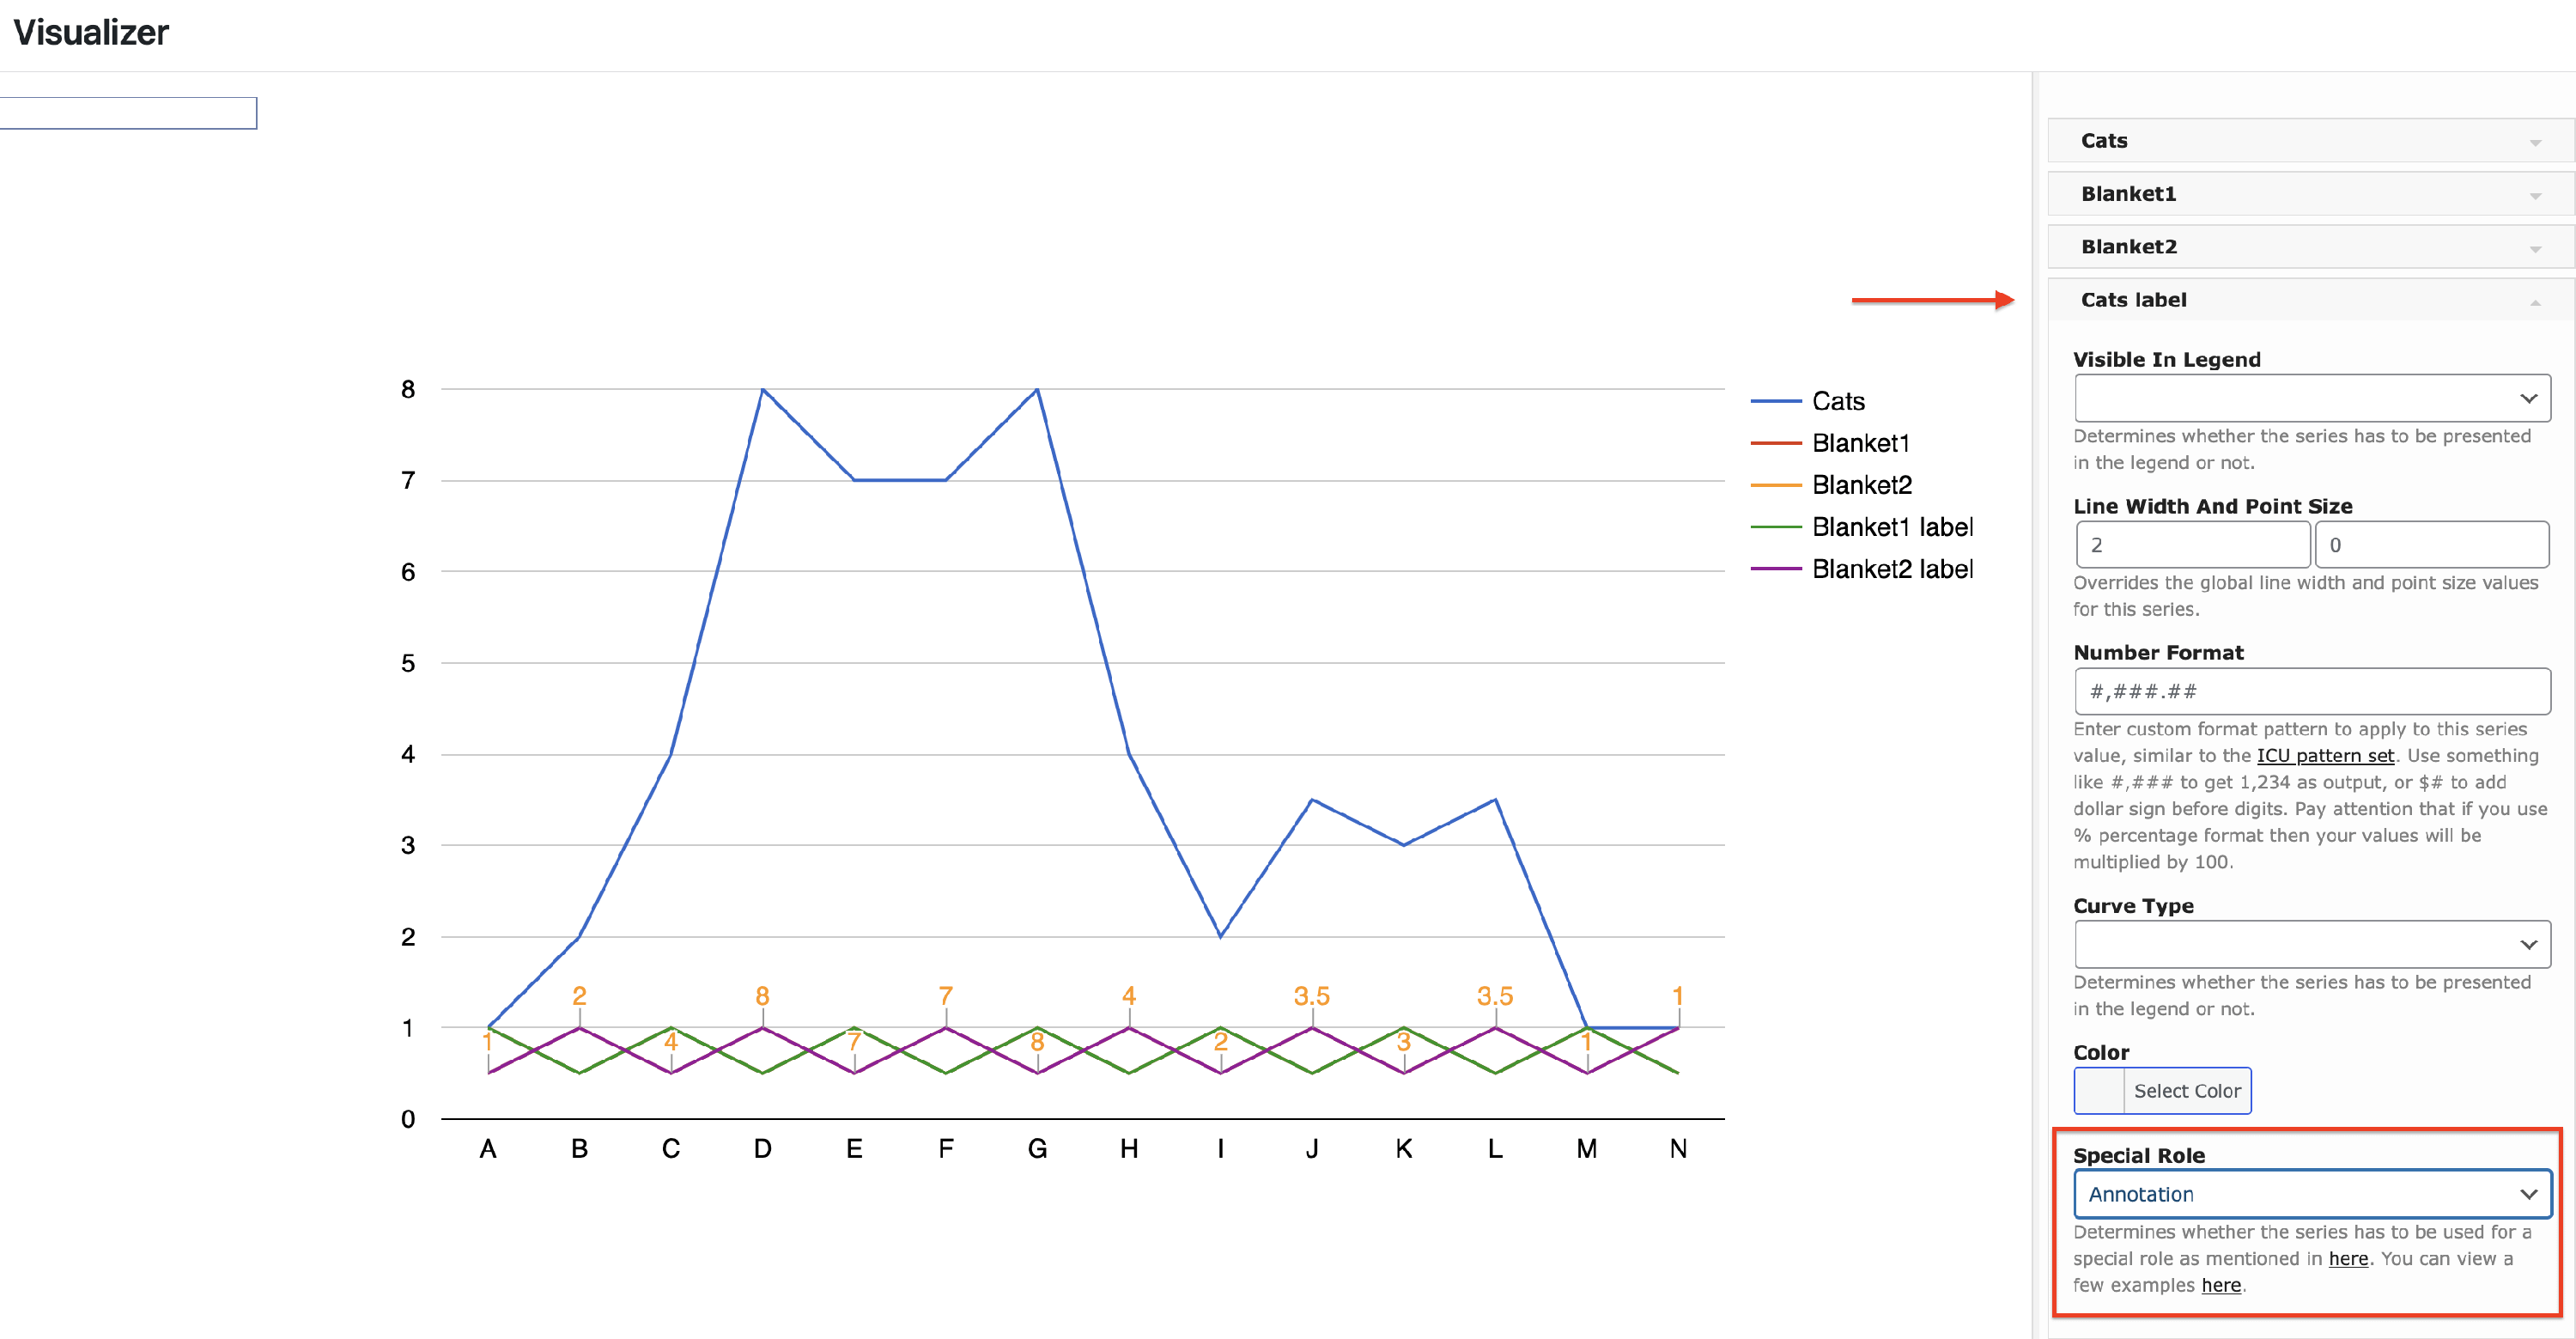
2. Navigate to Settings > Series Settings, there, you will see the new columns.
3. Click on each label column, then go to Special Role and select the Annotation role from the dropdown.