How can I populate data from Google Spreadsheet?
Visualizer lets you populate chart data directly from a Google Spreadsheet by publishing the sheet as a CSV and importing its URL, either as a full sheet or a selective subset using Google Query Language.
In this article
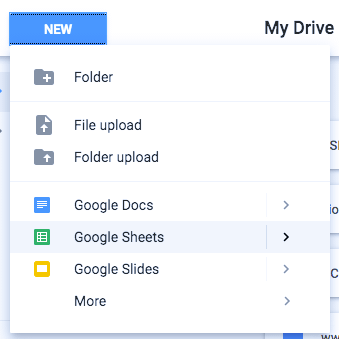
Step 1
Go to your Google Drive and create a new spreadsheet document.
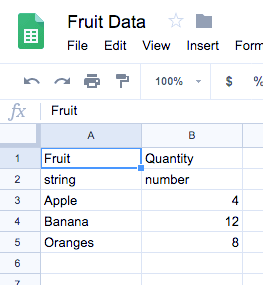
Step 2
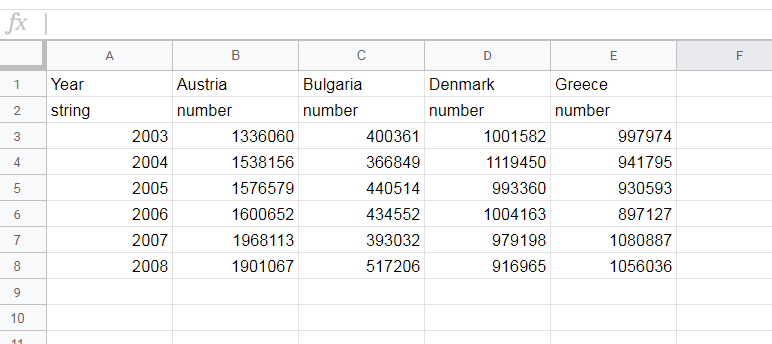
The first line of the spreadsheet should contain the series titles. The second line of the spreadsheet must contain the type of series’ data. You may use one of six data types: string, number, boolean, date, datetime, and timeofday. Enter these type names exactly as shown, values such as time date or time of day will cause the import to fail. The other lines need to contain data values according to the data type chosen.
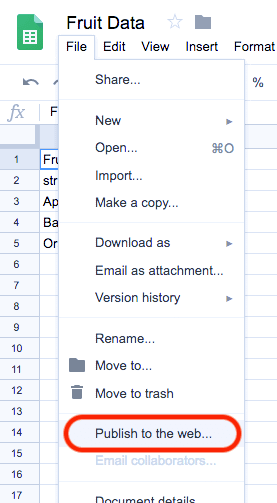
Step 3
After you enter your data, save the spreadsheet and click on "File" > "Publish to the Web…" menu item.
Step 4
In the new dialog, you need to click the "Start publishing" button. A link to the published item appears in the publishing dialog.
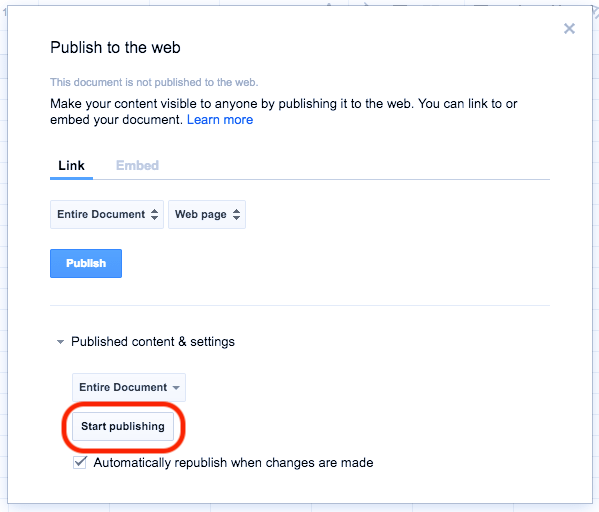
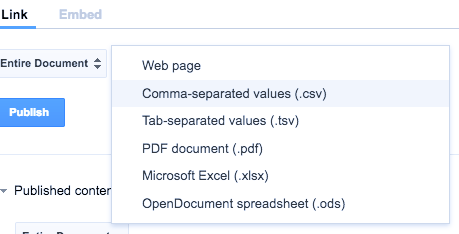
Choose "CSV (comma-separated values)" type and select the box below "Get a link to published data" sub header and copy link to the published spreadsheet at the text area below.
Step 5
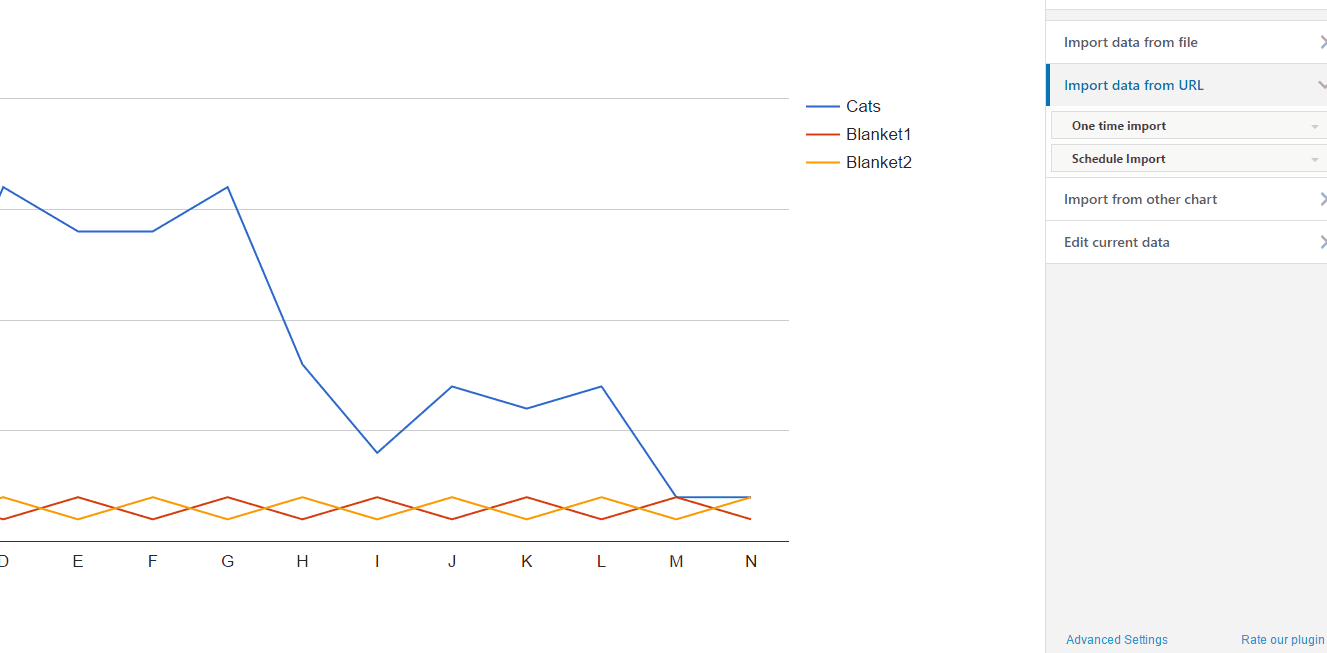
After you've published your spreadsheet, create a new chart or edit an existing one and go to the Source step. Expand the Import data from URL section, then Import from CSV / XLSX. Enter the published link into the URL field, choose an import schedule from the dropdown (select One-time for a single import), and click Import. After you have entered the link, the data will be uploaded automatically and the chart preview will update.
📝 Note: Importing data from a URL, including Google Spreadsheets, is a PRO feature. See the PRO version for details.
Use a subset of the spreadsheet
Let's say you have a document with many columns but you only want to use a subset of the data. You can fetch a subset of the data using the Google Query Language. Let's assume you have the following columns in the sheet and want to extract only columns A, C and E from it.
Step 1
Click on "File" > "Publish to the Web…" menu item.
Step 2
In the new dialog, you need to click the "Start publishing" button. A link to the published item appears in the publishing dialog. Do not choose Choose "CSV (comma-separated values)" type.
Step 3
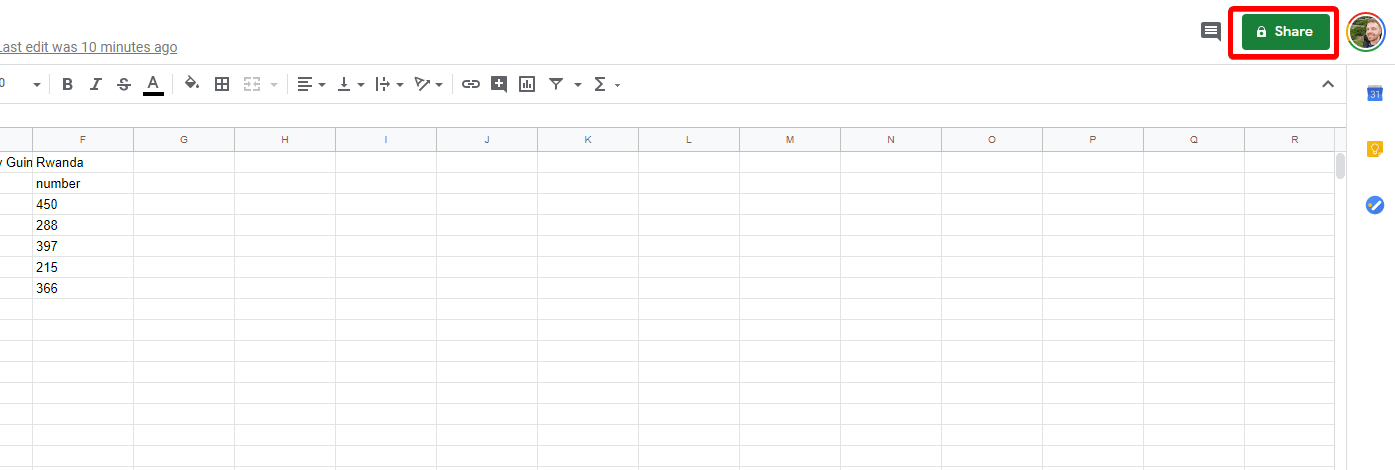
Now that your spreadsheet is published, it will be accessible to Visualizer once the link is provided. To obtain the correct link for the next steps, click the share button in the top right:
 Then, on the popup, click "copy link" and save this link. It should look like this:
https://docs.google.com/spreadsheets/d/1IcBzqIbaKoKcOsfJ0aAQMdqNmQBqvaBKzOFuTntooZs/edit?usp=sharing
Step 4
Using Google Query Language write down the query that most accurately fetches the subset of data. In this example, the query would be
select A,C,E
Use the encoder (found on that same page) to get the correctly encoded query and copy it.
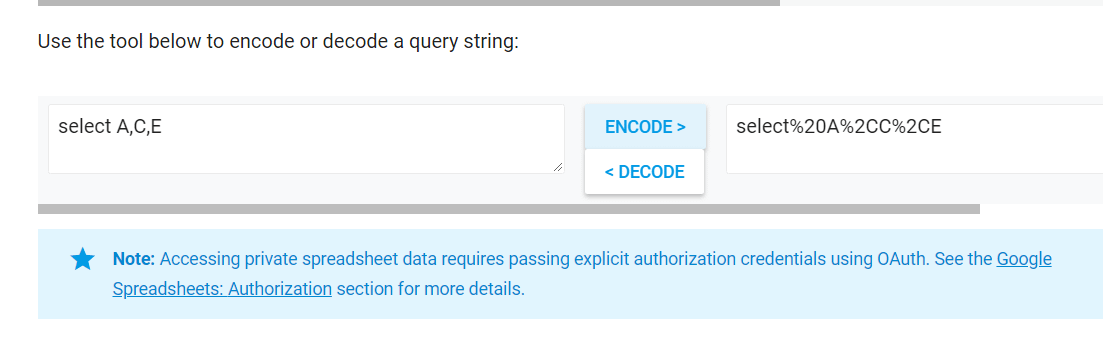
Put the query into this string: gviz/tq?tq=<QUERY>__&tqx=out:csv
In our example, we would obtain this: gviz/tq?tq=SELECT%20A%2CC%2CE&tqx=out:csv
Step 5
Now all we have to do is put things together to create the final link
This was our link from step 3: https://docs.google.com/spreadsheets/d/1IcBzqIbaKoKcOsfJ0aAQMdqNmQBqvaBKzOFuTntooZs/edit?usp=sharing
And this was our query URL from step 4: gviz/tq?tq=SELECT%20A%2CC%2CE&tqx=out:csv
Now, let's remove the last part of the url (edit?usp=sharing) and replace it with our new query string. The result should look like this:
You can now provide this link within Visualizer for its data to be imported, as it is done in Step 5 of the previous section.
Use Cases
Dynamically display form data - based on the data in the Google Spreadsheet, charts can be dynamically created and updated. Using Visualizer, you can display information from a form that saves data in a Google Sheet and update it in real time. By publishing the Google Sheet in CSV format, as we have described above, the URL source will be rendered by Visualizer, and charts will be updated live based on users' input.